---
schema_version: 1
title: 'Administrative Burden and Procedural Denials: Experimental Evidence from SNAP'
authors:
- Eric Giannella
- Tatiana Homonoff
- Gwen Rino
- Jason Somerville
language: en
edition: Final-submission author manuscript
paper_url: https://jason-somerville.com/papers/administrative-burden/
pdf_url: https://jason-somerville.com/files/administrative-burden/paper.pdf
format: Markdown with TeX mathematics
---
# Administrative Burden and Procedural Denials: Experimental Evidence from SNAP[^1]
Eric Giannella; Tatiana Homonoff; Gwen Rino; Jason Somerville
## Abstract
Many government program applications result in procedural denials due to administrative burdens associated with applying. We identify the intake interview as a key barrier to take-up of the Supplemental Nutrition Assistance Program and study the effect of an alternative application process designed to reduce burdens. Using a field experiment involving 65,000 Los Angeles applicants, we find that access to flexible interviews initiated by the applicant increases approvals by six percentage points, doubles early approvals, and increases long-term participation by over two percentage points. Our findings highlight the importance of incorporating flexibility when designing program integrity policies to minimize procedural denials.
## Introduction
Government programs are often marred by administrative burden and incomplete take-up (Currie 2006; Herd and Moynihan 2019). Many safety net programs entail a lengthy enrollment process involving complex applications and demonstration of program eligibility. These application hurdles have the potential to lead to procedural denials—rejections due to application errors or incompleteness rather than benefit ineligibility. For example, several programs, including the Supplemental Nutrition Assistance Program (SNAP), require applicants to complete an interview with a caseworker as part of the enrollment process.[^2] On the one hand, these interviews provide a point of contact during which caseworkers can offer additional application assistance or resolve any discrepancies in the submitted application. At the same time, the fact that the interview is a requirement may cause otherwise eligible cases to be denied solely due to a missed interview.
Consider the enrollment process for SNAP. All applicants must complete a caseworker interview within thirty days of applying for the program. These interviews, which primarily take place over the phone, are typically scheduled by the SNAP offices without consideration for the applicant’s availability. Applicants that miss their scheduled interview and do not reschedule before the deadline are denied access to the program. This process results in a high proportion of missed interviews and, in turn, application denials. In 2019, one third of all applications in Los Angeles County were denied due to a missed interview, more than all other reasons for denial combined. This suggests that procedural barriers—especially those related to the intake interview—are a key factor leading to incomplete take-up.
In this paper, we study the effect of an alternative SNAP application process designed to alleviate barriers to program access associated with the intake interview by increasing its flexibility. Specifically, our intervention provided access to flexible interviews that are initiated by the individual applicant to a randomly selected subset of SNAP applicants in Los Angeles County. This interview process is the first of its kind in California, though it closely mirrors that of a small but growing number of states with an operations waiver to conduct unscheduled SNAP interviews.
To evaluate the effect of this alternative interview process, we conducted a large-scale field experiment involving 65,000 Los Angeles County SNAP applicants. Our sample includes all cases that applied to the program through GetCalFresh.org, an online application system which receives more than half of the SNAP applications in Los Angeles. All applicants, regardless of experimental group, were assigned a scheduled interview date through the standard process. Applicants assigned to the treatment group received communications informing them that, alternatively, they could reach out to the county directly to conduct their interview at a time of their choosing using a newly established call center called the “end-to-end” (E2E) line.
We find that access to flexible interviews significantly increased SNAP participation rates in both the short and long term. Applicants in the treatment group were 6.2 percentage points more likely to be approved by the 30-day deadline (a 13 percent increase). While control group members partially catch up over time by reapplying or resolving pending applications after the deadline, we find that the intervention led to a significant increase of 2.2 percentage points (4 percent) in the likelihood of ever participating in SNAP by the end of our five-month follow-up period. The size of the treatment effect is particularly striking given that only half of treatment group members ever called the E2E line. For each additional month of SNAP benefit receipt induced by the intervention, households received an average of \$375 per month. The intervention also expedited benefit receipt: early approvals, defined here as applications approved within five days of applying, doubled from 14 percent in the control group to 27 percent in the treatment group.
Overall, we find that incorporating flexibility into the interview process increases access and expedites benefit receipt. However, our intervention design comes with several potential trade-offs relative to the standard process that relies on scheduled interviews. First, traditional scheduled interviews allow administrators to allocate appointments based on caseworker availability; conversely, offering unscheduled interviews may lead to long wait times during periods of high demand. To explore whether increases in demand limit the efficacy of the E2E interview process, we leverage a natural experiment, in which uncertainty regarding the timing of the expiration of pandemic unemployment benefits led to a large and unexpected spike in SNAP applications at the end of 2020, roughly halfway through our intervention. Although wait times did increase, we find no changes in the treatment effect during this temporary surge in demand, suggesting that the E2E process was able to withstand substantial increases in call volume. Second, it is possible that a shift in resources toward unscheduled interviews may have worsened outcomes for those receiving standard scheduled interviews. To test for this possibility, we use variation in the timing of the roll-out of E2E across the more than thirty SNAP offices in the county to determine whether applicants in the control group experienced worse application outcomes once E2E was expanded to their office. Using an event-study design, we find no effect on the approval rate of control applicants in the same offices. Consistent with our experimental results, we find large and significant increases in treatment group approval rates at the time of E2E initiation.
One final concern relates to a literature that investigates the effectiveness of administrative burden as a targeting mechanism. Some theoretical work has proposed that increased hassle costs can improve program targeting (Nichols and Zeckhauser 1982), while others have argued that they can worsen targeting (Deshpande and Li 2019). We find no evidence that interview flexibility worsens targeting; if anything, the increases in participation that we observe are largest among applicants who qualify for expedited (emergency) benefits—a determination based on extreme need.
It is worth noting that our specific intervention design alleviates concerns regarding impacts on program integrity, as the policy change we consider does not remove any eligibility verification steps—all applicants must still complete an interview to be approved. Consequently, we find no evidence that interview flexibility leads to a decrease in program integrity; our treatment effects are driven solely by applicants who we estimate to be eligible. At the same time, our results highlight the importance of incorporating flexibility into the design of program integrity policies to minimize procedural denials.
Our paper contributes to the growing literature on the effects of administrative burdens in the US safety net. Several prominent examples from the literature focus on the “learning costs” associated with program participation, such as program awareness or difficulties understanding eligibility rules. These interventions find that providing personalized estimates of program eligibility based on tax records or participation in other means-tested programs can lead to large increases in take-up of government benefits (Finkelstein and Notowidigdo 2019; Bhargava and Manoli 2015; Bettinger et al. 2012) or college scholarships (Dynarski et al. 2021), while others find no effect of informational outreach (Bergman et al. 2019; Linos et al. 2022).[^3]
An important distinction regarding our experimental population is that all individuals in our sample had already submitted a SNAP application at the time of randomization. This means that all applicants in our experiment were aware of the program and believed themselves to be likely eligible, allowing us to better isolate the effect of a second component of administrative burden: “compliance costs.” These costs include hurdles associated with adhering to program rules and requirements, such as completing complex forms, demonstrating eligibility, and meeting with caseworkers. Our findings complement prior research which demonstrates that reducing compliance costs by simplifying claiming processes, providing application assistance, or reducing travel time to program offices increases take-up of the Earned Income Tax Credit (Kopczuk and Pop-Eleches 2007), income-driven student repayment plans (Mueller and Yannelis 2022; Herbst 2022), DI (Deshpande and Li 2019), and WIC (Rossin-Slater 2013).
Our paper most closely builds on prior work that identifies the SNAP recertification interview, which typically takes place annually starting a year after enrollment, as a potential barrier to SNAP retention among current participants (Mills et al. 2014). This literature highlights the potential of reminders to reduce learning costs (Lopoo et al. 2020) and the importance of flexibility, such as additional time for interview completion, to reduce compliance costs (Homonoff and Somerville 2021). In this paper, we demonstrate that SNAP interview completion is a key barrier to participation—even at the initial application stage when the program requirements are more likely to be top-of-mind and the need for benefits is high—by identifying and evaluating a promising programmatic design feature that incorporates flexibility in the interview process, a version of which is already being implemented in several states.
## Institutional Background
### Supplemental Nutrition Assistance Program
The Supplemental Nutrition Assistance Program (SNAP) is the largest nutrition assistance program in the US, serving over 40 million people at a cost of \$79 billion in 2020. The program provides funds for food purchases to low-income households. SNAP benefits typically vary by income and household size; however, in March 2020, the Families First Coronavirus Response Act increased benefits for all households to the statutory maximum. At the start of our intervention, a single-person household could receive a maximum benefit of just over \$200 per month, while a family of four could receive up to \$680 per month. The maximum benefit amount increased by an additional 15 percent in January 2021 through the Consolidated Appropriations Act and remained in effect throughout our study period.
In California, SNAP is known as CalFresh and administered at the county level. In Los Angeles, the Department of Public Social Services is responsible for CalFresh. Los Angeles has one of the highest SNAP caseloads in the US, serving 1.3 million individuals per month in FY2020. To qualify for Calfresh, households must have gross income below 200 percent of the federal poverty line and net income below 100 percent of the federal poverty line.[^4] Los Angeles issued roughly \$270 million in benefits each month in FY2020.
### SNAP Application Process
To successfully enroll in SNAP, individuals must first submit an application to assess program eligibility. Applicants provide details and supporting documentation on household information including income, expenses, immigration status, and residency for all individuals in the household. Applications can be submitted in person, by mail, or online. Individuals can submit online applications and supporting documents through the county’s website or through an online portal administered by Code for America, a non-profit organization, called GetCalFresh.org. GetCalFresh was introduced as an alternative online application—or a “digital enrollment assistant”—designed to streamline application questions and provide additional support throughout the enrollment process. GetCalFresh receives the application, forwards it to the appropriate SNAP office, and provides the applicant with additional communication and support throughout the application process. GetCalFresh operates in all 58 counties in California and currently receives roughly half of all SNAP applications in Los Angeles (Appendix Figure [A.1](#fig:online_method)). GetCalFresh applications are provided in three languages: English, Spanish, and Chinese.
In addition, federal law requires that all applicants complete an interview with a SNAP caseworker. The SNAP interview process in the majority of states, including California, is as follows. Once an individual has submitted their application, it is sent to a SNAP office and assigned an interview date and time. In California, all interviews must be scheduled as promptly as possible after application submission. In practice, interviews in Los Angeles County are scheduled to occur within 10 days of the application submission; interviews for cases that qualify for expedited benefits are assigned to interviews within three days of application submission.[^5] Interviews take place over the phone if the applicant has provided a phone number with their application, otherwise they take place face-to-face at a SNAP office.[^6] Households are assigned to caseworkers who speak their preferred language.[^7] Applicants are informed of their interview appointment date and time by mail through an appointment letter (see Appendix Figure [A.2](#fig:appointment_letter)). Additionally, applicants who apply through GetCalFresh receive an electronic communication—text, email, or both—written in the applicant’s preferred language upon application submission reminding them that the county will be calling them in the upcoming days to conduct an interview.[^8] Caseworkers call the applicant up to three times within the scheduled interview window, after which they record the interview as incomplete. If an applicant misses the call from their caseworker, they are referred to a call center to reschedule. Applications are denied if an interview is not completed within 30 days of application.
During these interviews, caseworkers offer applicants assistance with their application and ensure that they are not denied due to missing or contradictory information. At the same time, the interview is a *requirement*: applicants who have successfully completed their application form and submitted the necessary documentation, but who have not completed a caseworker interview, are denied.
A summary of application outcomes reveals a potential consequence of this policy design. Figure [1](#fig:app_outcomes) presents outcomes for all GetCalFresh applications in Los Angeles County during a seven month period in late 2018 and early 2019, roughly two years prior to the start of our study. Only 44 percent of all applications were approved with the vast majority of denials resulting from procedural issues related to the enrollment process rather than concerns related to program eligibility. Specifically, one in three applications were denied for a missed interview, more than all other reasons for denial combined. In contrast, only 6.5 percent of applications were denied due to ineligibility.
Appendix Table [A.1](#tab:denial_by_subgroup) presents the data from Figure [1](#fig:app_outcomes) for several subgroups that are plausibly correlated with eligibility. These include whether the household qualifies for expedited benefits, lives in stable housing, has a job, includes an individual who is elderly or disabled, or receives SSI. Approval rates and rates of denial for missed interviews vary somewhat across certain characteristics. For example, unemployed households have an approval rate of just over 50 percent versus only one in three for working households, with working households experiencing a much higher rate of denial for missed interview. In other cases, these statistics look quite similar across subgroups: for example, the rates of denial for missed interview are nearly identical for the third of households in the sample who do not live in stable housing, a key marker of financial vulnerability, and those that do. Importantly, for each subgroup considered, more than a quarter of applications are denied for missed interview. Therefore, while it is possible that some cases that missed their interview may have ultimately been determined to be ineligible, that we observe high rates of procedural denials among even the neediest households suggests the low approval rates we observe are unlikely to be driven solely by applicant ineligibility.
Surveys of denied applicants conducted by Code for America staff also point to the intake interview as an important barrier to enrollment. Respondents described the lack of flexibility in the interview process as a key issue. In particular, they highlighted the challenges of completing an interview that is scheduled without their input, resulting in conflicts with work or family obligations. This scheduling issue was exacerbated by the difficulty in connecting with caseworkers to reschedule interviews.[^9] Additionally, some respondents commented that they were unaware of their appointment time due to the fact that this important information was only communicated via mail.
## Intervention Design
Alongside the standard application process described above, Los Angeles operated a small pilot program called the “End-to-End” (E2E) line. Through this process, individuals who called into the SNAP office were connected to a caseworker who would help them complete their application and conduct their interview in the same call. This service operated on a very small scale with only a few caseworkers assigned to staff the call line.[^10]
In 2020, Los Angeles expanded the E2E program and refocused its services on assisting applicants with interview completion rather than application assistance. Specifically, the county staffed a call line that offered the option of flexible, unscheduled interviews for individuals who had submitted an application. While this process was the first of its kind in California, it closely mirrors the interview assignment process in states utilizing an unscheduled interview operations waiver.[^11] Call line staff were drawn from the same pool of caseworkers who conducted traditional scheduled interviews including existing caseworkers as well as new caseworkers hired to meet the increased demand for SNAP caused by the pandemic.
To evaluate the effect of offering flexible interviews during SNAP enrollment, we partnered with Los Angeles County to conduct a large-scale randomized control trial involving the universe of applications submitted via GetCalFresh. Upon application submission, the county assigned all applicants an interview through the standard processes regardless of their treatment status, notifying them of the scheduled time via mail. Applicants assigned to the control group received the standard electronic communications from GetCalFresh informing them that their application had been received and that they would be hearing from the county to conduct their interview. Applicants assigned to the treatment group received a modified communication providing them with information on how to contact the E2E line to complete their interview. Applicants could call this number at their convenience and connect directly to a caseworker to complete their interview. Treatment group members who did not call the E2E line by their scheduled interview date were contacted by the county for an interview through the standard channels.
Communications were sent in one of the three languages supported by GetCalFresh based on the preferred application language selected by the participant. Applicants who completed their application in English or Chinese were directed to the main E2E line, which included branching for other languages, while applicants who competed their application in Spanish were provided a number that connected them to Spanish-speaking caseworkers directly. Both treatment and control communications were sent via text, email, or both depending on the stated preferences of the applicant. Initial communications were sent following application submission with a reminder message sent to both experimental groups the following business day.[^12] Table [1](#tab:messages) presents the treatment and control text messages and Appendix Table [A.2](#tab:reminders) presents the reminder messages.
Our sample includes the universe of applications submitted through GetCalFresh from Los Angeles County. Random assignment was conducted over an eight-month period between October 2020 to May 2021 and was rolled out in stages to the county’s 31 offices (see Appendix Figure [A.3](#fig:participating_offices)). Once an individual submitted their application to GetCalFresh, they were randomly assigned to either the treatment group (75 percent) or the control group (25 percent).
We make two minor sample restrictions. First, we exclude the roughly two percent of GetCalFresh applications that did not provide either a phone number or an email address—a necessary step for receiving our experimental communications. Second, since we implemented the randomization at the application level rather than the household level, we exclude all cases that submitted a repeat application within 30 days of the initial application to prevent the possibility that applicants were re-randomized before the initial application deadline (3.8 percent of cases in our sample).[^13] Our final sample contains 64,798 applications with 48,557 applications in the treatment group and 16,241 in the control group.
## Data
Our primary data set includes administrative data on all GetCalFresh application submissions. These data detail whether an application has been approved, denied, or is pending on each day post submission. We collect data on all reapplications via GetCalFresh within five months. In our experimental messages, each treatment member received a unique virtual number to connect to the E2E line allowing us to link call information to individual applicants. While we do not have wait times for each call, our data include daily county-wide estimates of call volume as well as average call and wait times. Finally, these data contain all demographic characteristics included in the initial application including financial information used to assess the applicant’s eligibility (such as household size and income), additional demographic characteristics (such as age and sex of applicant), and which office each case is assigned to based on their address.
The data have a few limitations worth noting. First, we do not have information on intermediate process outcomes such as interview completion or whether income and other verification documents were submitted, nor the date on which the interviews scheduled by the county are assigned. Second, the daily case status data only extend for 90 days post-application. As a result, we do not observe exits from the program that occur after this period. Finally, our reapplications data are limited to applications through GetCalFresh.[^14]
## Results
### Sample Characteristics
Table [2](#tab:sumstat) summarizes the characteristics of the applicants in our sample, overall and by experimental group. Column 1 reports the summary statistics for the entire sample. The average applicant had a household size of 1.7 people and was 37 years old. Sixty percent of applicants were female, 17 percent had an elderly or disabled member, 10 percent received SSI, and 86 percent spoke English as their primary language. In terms of finances, just under half of applicants (45 percent) had some income in the past month with an average income of \$709 and just over half (55 percent) had any money on hand with an average of \$1,000 across all applicants. Only 60 percent lived in stable housing and the average rent was higher than the average income (\$768 per month). These statistics highlight the vulnerability of applicants in our sample. GetCalFresh uses this data to assess whether a case qualifies for expedited benefits and computes an initial estimate of whether a case is eligible based on their self-reported data. Fifty-three percent of applicants qualified for expedited benefits due to having little or no income and cash on hand and 90 percent of applicants were estimated to be eligible for SNAP.
Columns 2 and 3 report the sample characteristics separately for the treatment and control groups and column 4 presents the $p$-value associated with an F-test for equality across the two experimental groups. For all but one characteristic, we cannot reject equality across the two groups. We observe a small, but statistically significant difference in the average household sample across experimental groups. However, Table [2](#tab:sumstat) also reports the results of a joint significant test based on regressing an indicator for treatment status on all case characteristics. We find no evidence that the characteristics of a case are predictive of treatment status. Nevertheless, our preferred specification controls for all of the application characteristics reported in this table.
### Intervention Take-up: Calls Data
We provide all treatment group members with the option of calling the E2E line to conduct an interview; however, many may ignore the communication or choose not to call. Similarly, while we did not provide control group members information on how to reach the E2E line, it is possible that they obtained access to the call line number through another source. Table [3](#tab:calls) presents data on call characteristics for the two experimental groups—the “first stage” of our intervention.
Within the treatment group, 53 percent of applicants called at least once before their application deadline with 87 percent of those callers remaining on the line for at least five minutes—a conservative estimate for the minimum length of time needed to complete an interview. The average caller called just under two times and spent a total of 37 minutes on the phone, with the average longest call per household lasting 32 minutes. County-level data shows that the E2E line received an average of 350 calls per day with an average wait time of only 2.5 minutes. As designed, less than 0.5 percent of control group applicants ever called. Appendix Figure [A.4](#fig:calls_by_day) shows that half of all callers contact the E2E line the same day that they receive the treatment message and 90 percent call within three days.
Table [4](#tab:compliers) compares the characteristics of those who call the E2E line due to receiving the treatment (compliers) to those that do not call in the control group (potential compliers). The random assignment of applications to the treatment and control groups allows us to estimate the covariates of compliers, and to compare them to those of potential compliers. Table [4](#tab:compliers) provides a comparison of the average case and demographic characteristics using the approach in (Marbach and Hangartner 2020) to estimate the covariate means for the compliers.[^15] We find that compliers are more likely to be from three groups correlated with need: expedited cases, cases with no income in the past 30 days, and likely eligible cases. At the same time, they were less likely to live in unstable housing. Overall, while we document some statistically significant differences across case characteristics, the magnitudes of most differences are often small and do not indicate a consistent qualitative pattern in terms of heterogeneity.[^16]
### Initial Application Outcomes
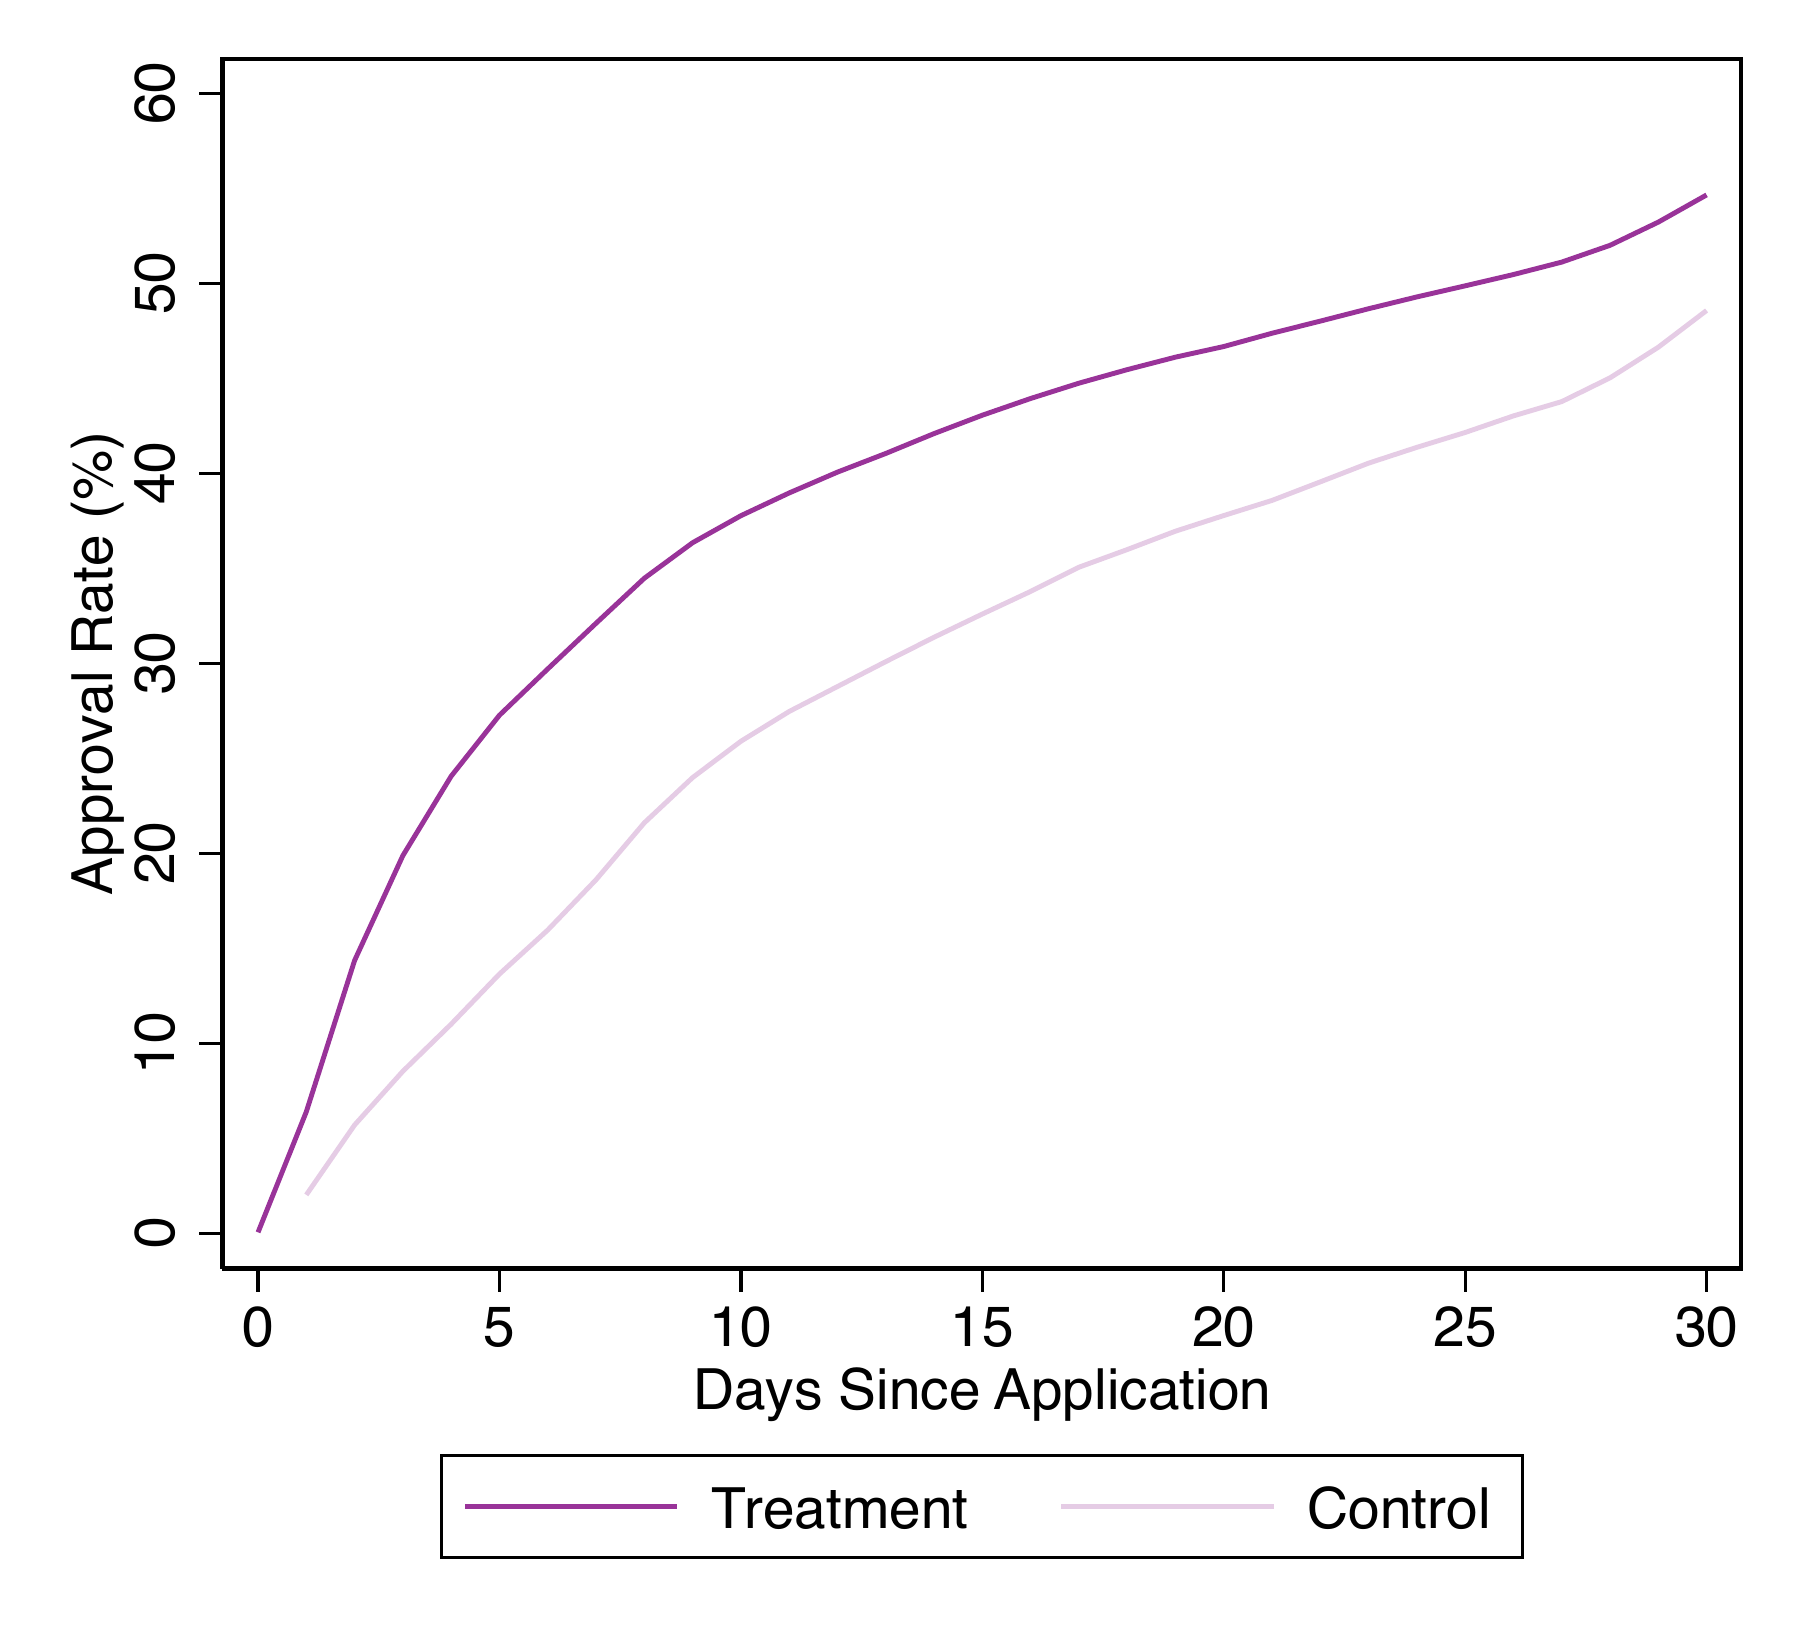
Figure [2](#fig:approvals) plots the share of applications approved by days since submission separately for each experimental group. The figure shows a striking difference in approval rates between the two groups that emerges over the first week after application submission. By day five, 27 percent of treatment group applications were approved, compared to only 14 percent of control group applications. Recall that standard interviews are scheduled within three days of application submission for households eligible for expedited benefits (roughly half of our sample) and ten days for all other cases. Therefore, it is possible that early increases in approvals among the treatment group may be partially due to construction: applicants cannot be approved until they have completed an interview and non-expedited, control group cases assigned to later interview dates cannot be approved by day five unless they proactively reschedule their interview date to take place earlier. However, we find that the difference in the approval rate between experimental groups at day 10 (the last assigned date for scheduled interviews) is nearly just as large—38 percent of treatment members were approved versus 26 percent of the control group.
This difference decreases somewhat over the course of the month, but a large gap in approval rates persists at the 30-day application deadline: 55 percent of applications in the treatment group were approved compared to only 49 percent in the control group. This suggests that the intervention not only expedites benefit receipt, it increases the overall approval rate.
To formally test for differences in initial application outcomes across the treatment and control groups, Panel A of Table [5](#tab:main) presents results from the following econometric model, $$
Y_{it} = \alpha + \beta T_{i} + \gamma X_{i} + \nu Z_{t} + \varepsilon_{it}
$$ where $Y_{it}$ is the outcome for case $i$ applying to SNAP on date $t$, $T_{i}$ is an indicator equal to one if applicant $i$ was in the treatment group, $X_{i}$ is a vector of case characteristics included in the application, $Z_{t}$ is a set of time period controls including intervention week and day of week fixed effects, and $\varepsilon_{it}$ is an error term.[^17] The parameter $\beta$ provides an estimate of the intent-to-treat (ITT); that is, the causal effect of providing access to the E2E line on the outcome of interest.
We provide all treatment group members with the E2E number, however, many applicants may ignore our communication, as suggested in Table [3](#tab:calls). Therefore, we also provide results that instrument for ever calling the E2E line with treatment status in Panel B using the following joint specification: $$\begin{aligned}
Y_{it} &= \eta_0 + \eta_1 Called_{it} + \eta_2 X_{i} + \eta_3 Z_{t} + \varepsilon_{it} \\
Called_{it} &= \pi_0 + \pi_1 T_{i} + \pi_2 X_{i} + \pi_2 Z_{t} + \varepsilon_{it}
\end{aligned}$$ where $Called_{it}$ is an indicator equal to one if applicant $i$ ever called the E2E line as of time period $t$.
Column 1 of Table [5](#tab:main) estimates the effect of the intervention on whether the application was approved by the 30-day administrative deadline for determining a case. We find that approval rates were 6.2 percentage points higher for those with access to flexible interviews. This amounts to a 12.7 percent increase in the approval rate relative to the control group mean of 48.9 percent. Panel B shows that cases that were induced to call the E2E line as a result of receiving our treatment communications were 11.9 percentage points more likely to be approved relative to the control group, a 19 percent increase relative to the complier mean.
We also investigate whether access to flexible interviews expedited approvals and overall time to determination. Column 2 of Table [5](#tab:main) estimates the effect of the intervention on the timeliness of application processing, regardless of whether the application was approved or denied—a key performance metric for SNAP administrators.[^18] We find that applicants in the treatment group received a case determination four days earlier than those in the control group, a 20 percent decrease in processing time.
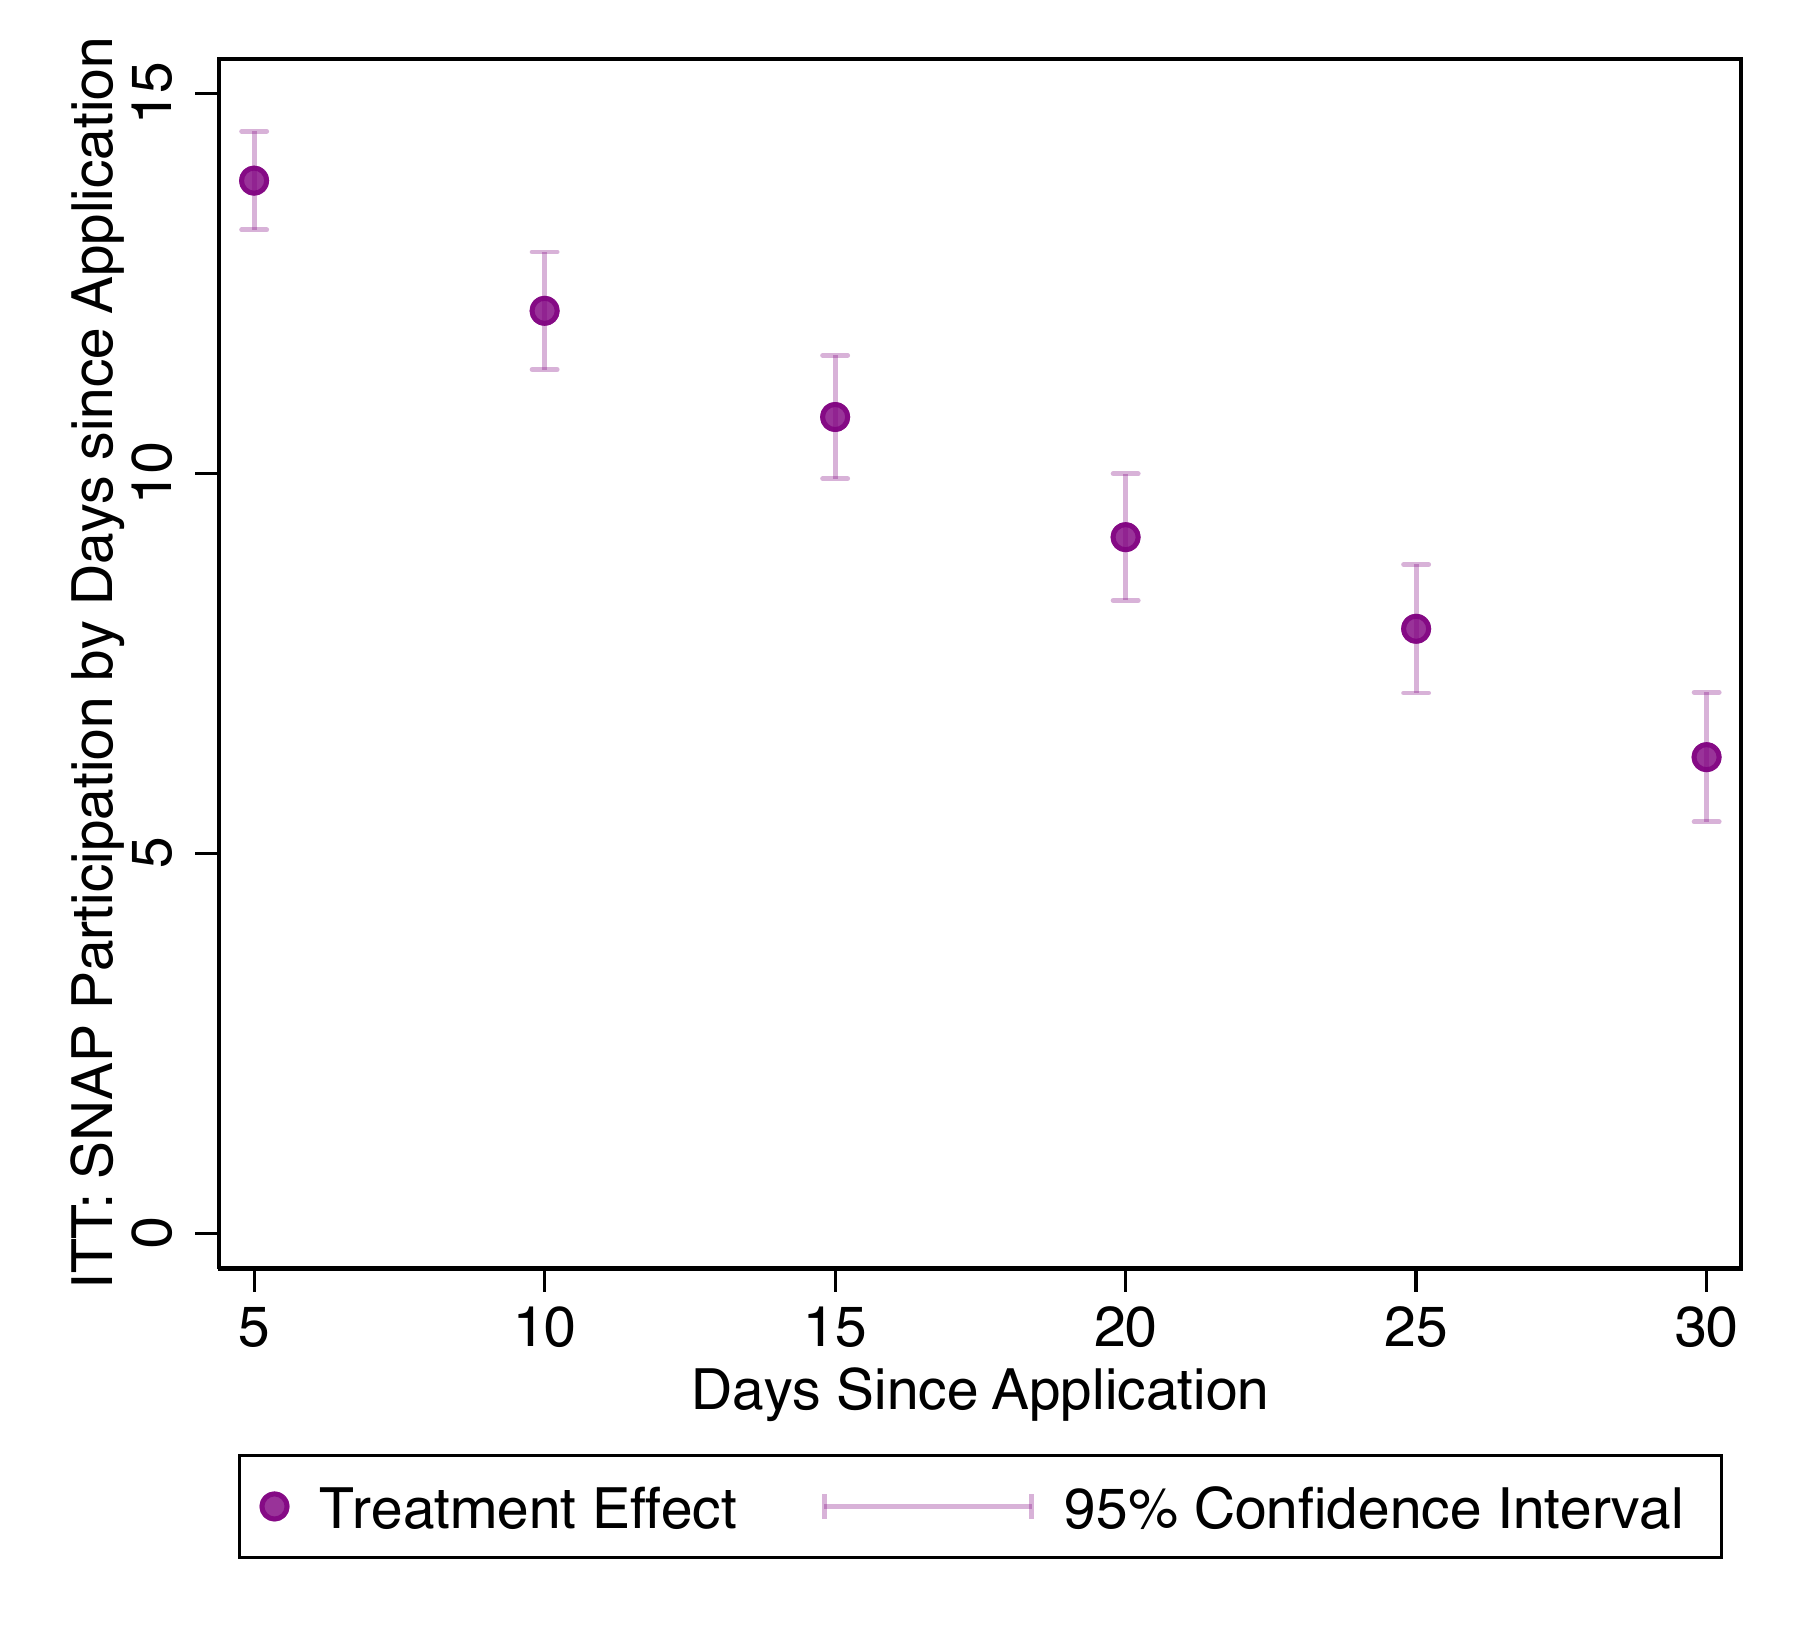
Figure [2](#fig:approvals).B presents treatment effects corresponding to the raw approval rates in Figure [2](#fig:approvals).A in five-day increments with coefficient estimates presented in columns 3-7 of Table [5](#tab:main). We find that the intervention increased the likelihood of being approved for SNAP within five days of application submission by 13.9 percentage points. This estimate suggests that the intervention doubled the five-day approval rate off a control mean of 13.7 percent. The treatment effects decline somewhat throughout the application review month, a sign that the control group catches up over time, yet remain large in magnitude and statistically significant: increases in the approval rate are 12.1, 10.7, 9.1, and 7.9 percentage points as of day 10, 15, 20, and 25 since application submission, respectively.
### Long-term SNAP Participation
The prior section demonstrates that access to flexible interviews increases and expedites SNAP approvals. In this section, we analyze the effect of the intervention on long-term SNAP participation. To do so, we extend our administrative data set in two ways. First, we follow the status of the initial application past the application deadline to determine whether initial denial decisions were subsequently overturned or pending cases were eventually approved. Second, we link our sample population to any reapplications through GetCalFresh in the five months following the initial submission. This data allows us to determine whether control group members who were denied as a result of the interview process eventually catch up to the treatment group in terms of their SNAP participation rate by subsequently reapplying or having their case reopened and approved after the deadline.
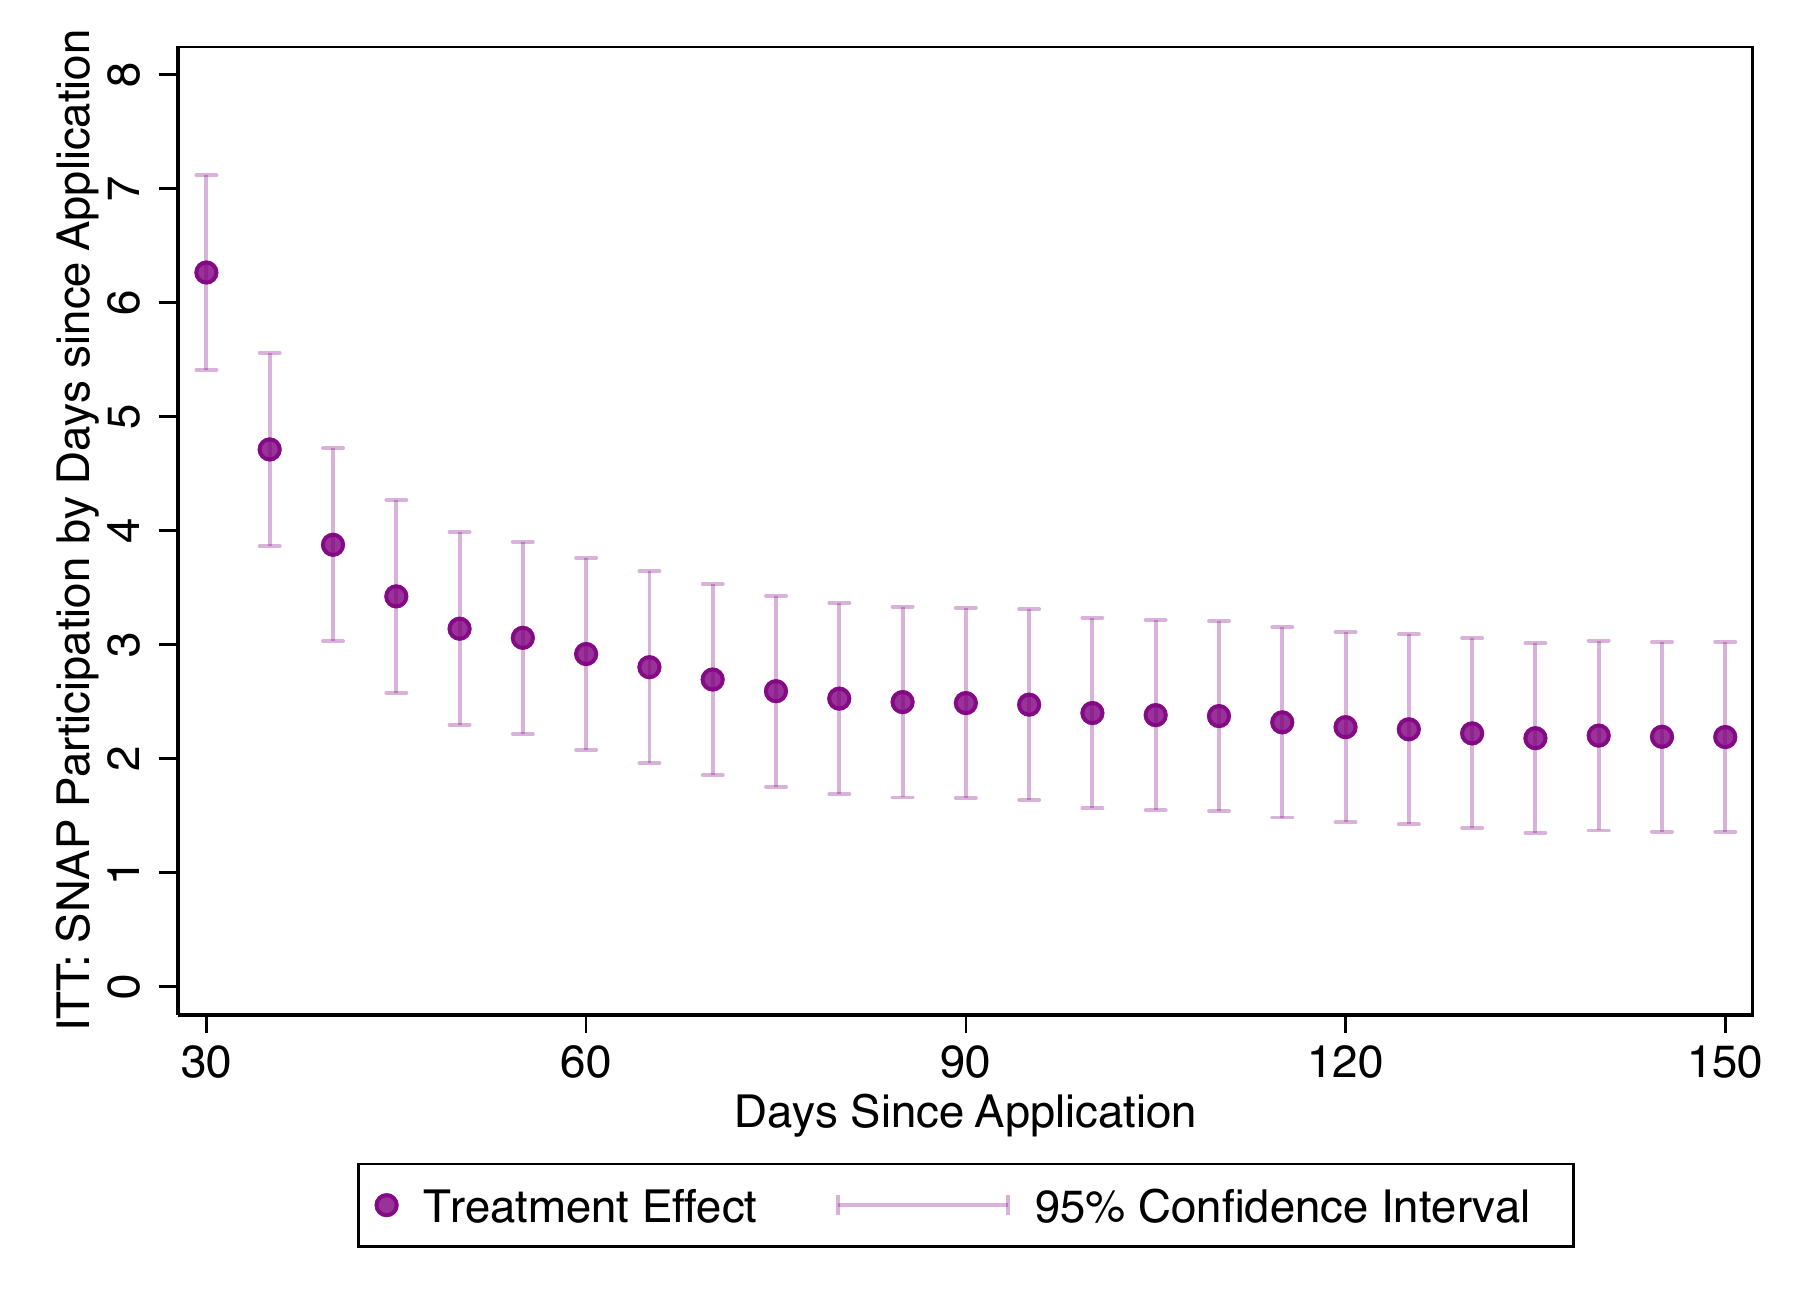
Figure [3](#fig:longterm) presents estimates of the treatment effect on the likelihood of ever participating in SNAP by days since the application deadline. We find the treatment effect declines during the two weeks following the end of the initial application review period, suggesting that a portion of control group members who are denied as a result of the interview process eventually gain access to the program. However, the treatment effects then stabilize and remain large and statistically significant. Column 1 of Table [6](#tab:long_term_participation) shows that the intervention led to a 2.9 percentage point increase SNAP participation 60 days after the application was submitted, roughly half the size of our estimated treatment effect on the initial approval rate. Beyond this point, we find relative stable estimates of the longer-term impact of providing access to flexible interviews: the impact of our intervention on SNAP participation falls slightly to 2.5 and 2.3 percentage points by day 90 and 120, respectively. Column 4 shows that the intervention led to a 2.2 percentage point increase in ever receiving SNAP during our five-month follow-up period.[^19] These findings demonstrate that the traditional interview process not only leads to delays in SNAP benefit access, but prevents a substantial fraction of applicants from ever enrolling in the program.
It is worth noting that since randomization occurs at the application level, any reapplications that occurred during the intervention were re-randomized. Therefore, control group members who reapplied after a denial had a 75 percent chance of eventually being treated. If our intervention also increases the approval rate of *re*applications, our estimates of the treatment effect on long-term participation will be biased downwards. We test for evidence of this bias directly by looking at the effect of receiving communications about E2E during the reapplication separately by initial treatment status in Appendix Table [A.6](#tab:reapp_exp).[^20] We find that control group reapplicants who were re-randomized to the treatment group upon reapplication—i.e., applicants who did not receive communications regarding E2E during their first application, but did for their second—were more likely to have their reapplication approved than control group reapplicants re-randomized to the control group, a 9.7 percentage point increase. Treatment group reapplicants re-randomized to the treatment group were also more likely to have a reapplication approved than treatment group reapplicants re-randomized to the control group, though these estimates are smaller in magnitude. However, we caution that the sample size of reapplicants is small (roughly 600 cases) and, therefore, the estimated treatment effects are not statistically significant. Nevertheless, this analysis provides suggestive evidence that our estimates of the long-term participation effects in Table [6](#tab:long_term_participation) are likely to be a lower bound.
### Benefit Receipt
Table [7](#tab:benefits) presents estimates of the effect of the intervention on benefit amounts received. Column 1 presents the ITT estimate for the benefit dollars received per month. We find that the intervention led to an increase of \$16 per month or \$80 over our five-month follow-up period for each household that received our communications regarding E2E. When aggregated across the 48,500 applicants who received our treatment messages, the intervention led to an additional \$3.9 million dollars in benefits distributed over the five-month follow-up period. Column 2 presents the results from our instrumental variables analysis which instruments for ever having called the E2E line with treatment status. This analysis shows that the benefit increases are roughly double the amount when focusing on those who called E2E. To estimate the monthly benefit gains among those who participated in SNAP as a result of receiving the treatment communication, column 3 regresses the number of months on SNAP during the five-month follow-up period, instrumenting for participation with the treatment status, on the total benefit dollars received. We find that for each additional month of benefits received as a result of the intervention, households received an average of \$375.
## Staffing Constraints
### Effects on Control Applicants
One concern with our intervention design relates to trade-offs regarding caseworker resources. For example, it is possible that the expansion of the E2E line came at the expense of staffing resources traditionally provided for conducting scheduled interviews. Any changes to the efficacy of the standard interview process would bias our results. To investigate this possibility, we use the staggered roll-out of the E2E expansion by office in an event-study framework to determine whether the introduction of E2E affects the control group approval rate. Specifically, this analysis compares control group and treatment group applicants in treated offices, respectively, to all applicants in untreated offices. Our data for this analysis include all GetCalFresh applications from all 31 offices in Los Angeles between August 1, 2020 (two months before the start of our intervention) and May 15, 2021 (the end of our intervention).
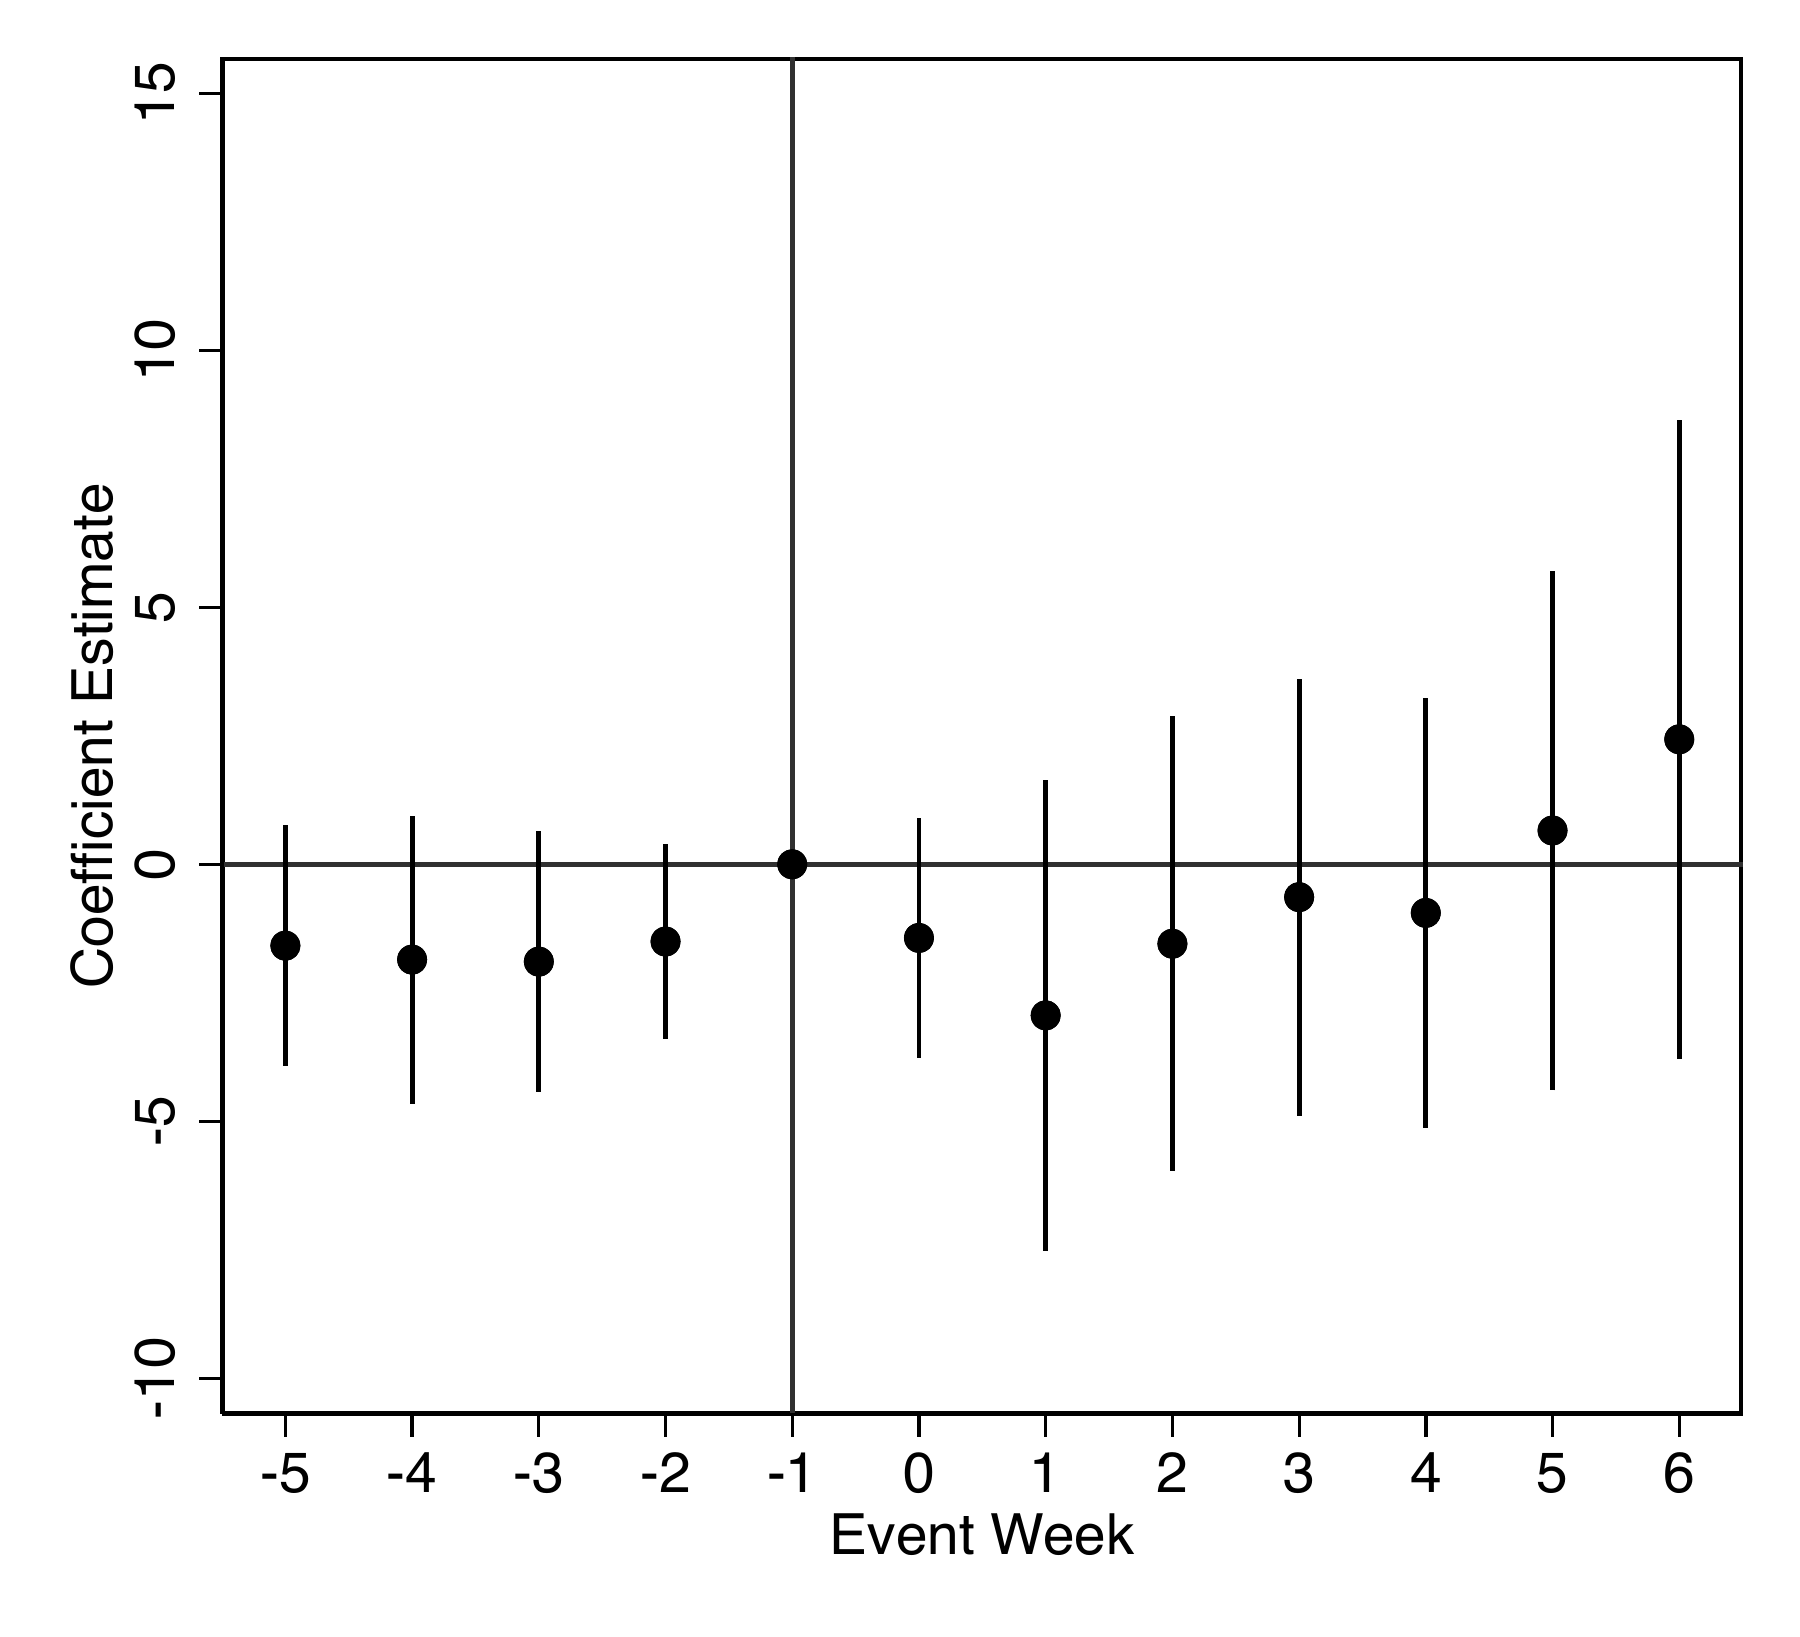
Figure [4](#fig:event).A presents the event-study analysis estimating the effect of E2E roll-out on application approval rates of control group members who were in offices that offered E2E but who were not themselves given access. While we observe a small and statistically insignificant decrease in approvals among control group members during the first week of E2E roll-out, this decrease rebounds by the third week of implementation. For comparison, Figure [4](#fig:event).B shows that the roll-out led to significant increases in approvals among treated applicants relative to applicants in untreated offices. These results suggest that our main findings are driven by improved outcomes for treated applicants rather than negative spillover effects of the intervention on untreated applicants.
Table [A.7](#tab:csdid) presents the corresponding (Callaway and SantAnna 2021) difference-in-differences estimator. Column 1 confirms that the roll-out of E2E did not lead to a significant effect on approval rates for untreated applications, though our large standard errors prevent us from ruling out somewhat sizable negative effects as well as modest positive effects of E2E roll-out on control group approvals \[95% CI: -5.62, 2.33\]. An added benefit of this analysis is that we can estimate the effect of our intervention on treated applicants using an alternative identification strategy. Similar to the results in our main experimental analysis, we find a statistically significant increase of 5.1 percentage points in the approval rate among treatment households \[95% CI: 1.89, 8.37\]. Given these confidence intervals, and the fact that our treatment group is more than three times the size of our control group, we can rule out that the intervention led to an overall decrease in approvals.[^21]
### Scalability
A separate, but related, concern relates to the scalability of our intervention. One benefit of scheduled interviews is that SNAP administrators can allocate appointments based on caseworker availability to avoid overwhelming staff. Conversely, allowing applicants to conduct unscheduled interviews could lead to staffing constraints and long wait times during periods of high demand which, in turn, could lead to decreases in interview completion and participation.[^22]
To determine whether unscheduled interviews test the capacity constraints of the application process, we use a natural experiment that unexpectedly increased SNAP applications during our intervention period. In March 2020, the Coronavirus Aid, Relief, and Economic Security (CARES) Act introduced several extensions to the Unemployment Insurance (UI) program including expanded eligibility, benefit amounts, and benefit duration. These expansions were set to expire on December 26, 2020, roughly halfway through our intervention. While the program was ultimately extended, the fate of the policy remained uncertain up until the deadline.
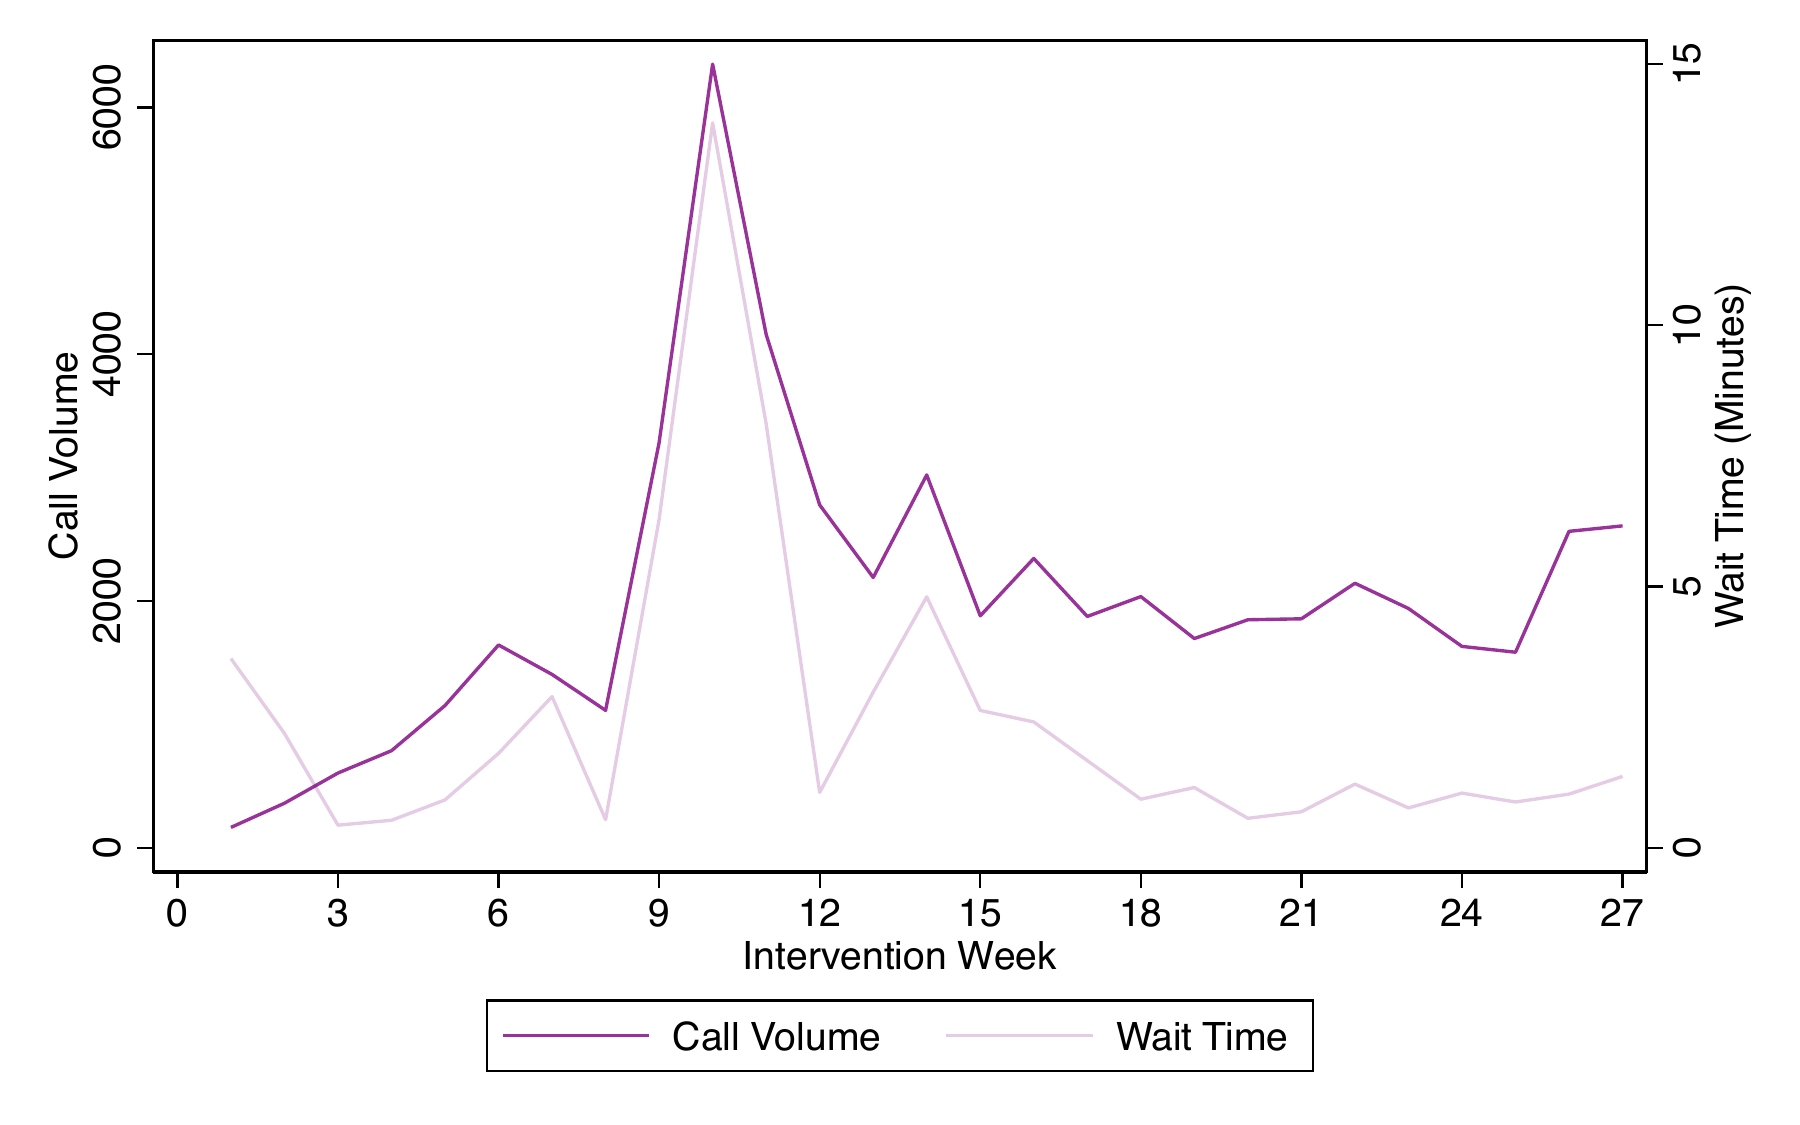
Prior to this decision, and in anticipation of the deadline, the California Employment Development Department, the agency that administers the state’s UI program, warned current UI recipients of the potential expiration of benefits on their website and included a link to GetCalFresh.org to encourage eligible recipients to apply. This action resulted in a three to four fold increase in calls to E2E, accompanied by an increase in wait times, during the weeks in which the link remained on the website (Figure [5](#fig:decembersurge).A).
Figure [5](#fig:decembersurge).B presents estimates of the treatment effect on long-term SNAP participation by intervention week to determine whether the temporary surge in demand led to differential treatment effects. While the treatment effects vary somewhat week to week, we do not find any observable differences during this period of unexpected increase in demand (the three weeks shaded in gray), highlighting the program’s ability to absorb even large fluctuations in application rates and pointing toward the likely scalability of our intervention (List 2022).[^23]
## Targeting, Program Integrity, and Office Variation
Table [8](#tab:subgroup) explores heterogeneity in our treatment effect. One motivation for this analysis is to determine whether access to flexible interviews improves targeting. For example, several papers in the literature find that administrative burdens improve targeting of safety net program take-up (Finkelstein and Notowidigdo 2019), consistent with the theoretical model in (Nichols and Zeckhauser 1982), while others find no effect or even worsened targeting (Bhargava and Manoli 2015; Deshpande and Li 2019; Homonoff and Somerville 2021), consistent with the model in (Deshpande and Li 2019). Columns 1 through 7 use information provided in the submitted application to explore heterogeneity by characteristics that are plausibly correlated with need. These include expedited status, income, money on hand, employment status, whether the applicant lives in stable housing, English as a preferred language and SSI receipt.
We find statistically significant differences in treatment effects for two of these subgroups: effects are significantly larger among cases that qualify for expedited benefits and marginally significantly smaller among SSI recipients. The first result is consistent with a model in which our intervention improves targeting, as expedited cases are those determined to be most in need.[^24] In contrast, the smaller effects for SSI recipients suggest that our intervention may, in fact, worsen targeting. However, conversations with Los Angeles staff reveal an alternative explanation for the near-zero effect of the intervention for SSI recipients: SSI recipients, when assisted by a Social Security Administration caseworker in applying for SNAP, are typically exempted from the interview altogether. As a result, we interpret these results not as evidence of worsened targeting, but rather find the differential impact by SSI receipt to be an encouraging placebo test demonstrating that applicants who are less likely to be subject to the interview requirement are also less likely to be affected by the intervention.
A related motivation for our heterogeneity analysis is to explore whether the intervention appears to worsen program integrity; that is, whether cases that appear ineligible are more likely to have their case approved when they have access to flexible interviews. Column 7 of Table [8](#tab:subgroup) presents results by estimated eligibility and finds that the treatment effects are fully concentrated among applicants who appear eligible.[^25]
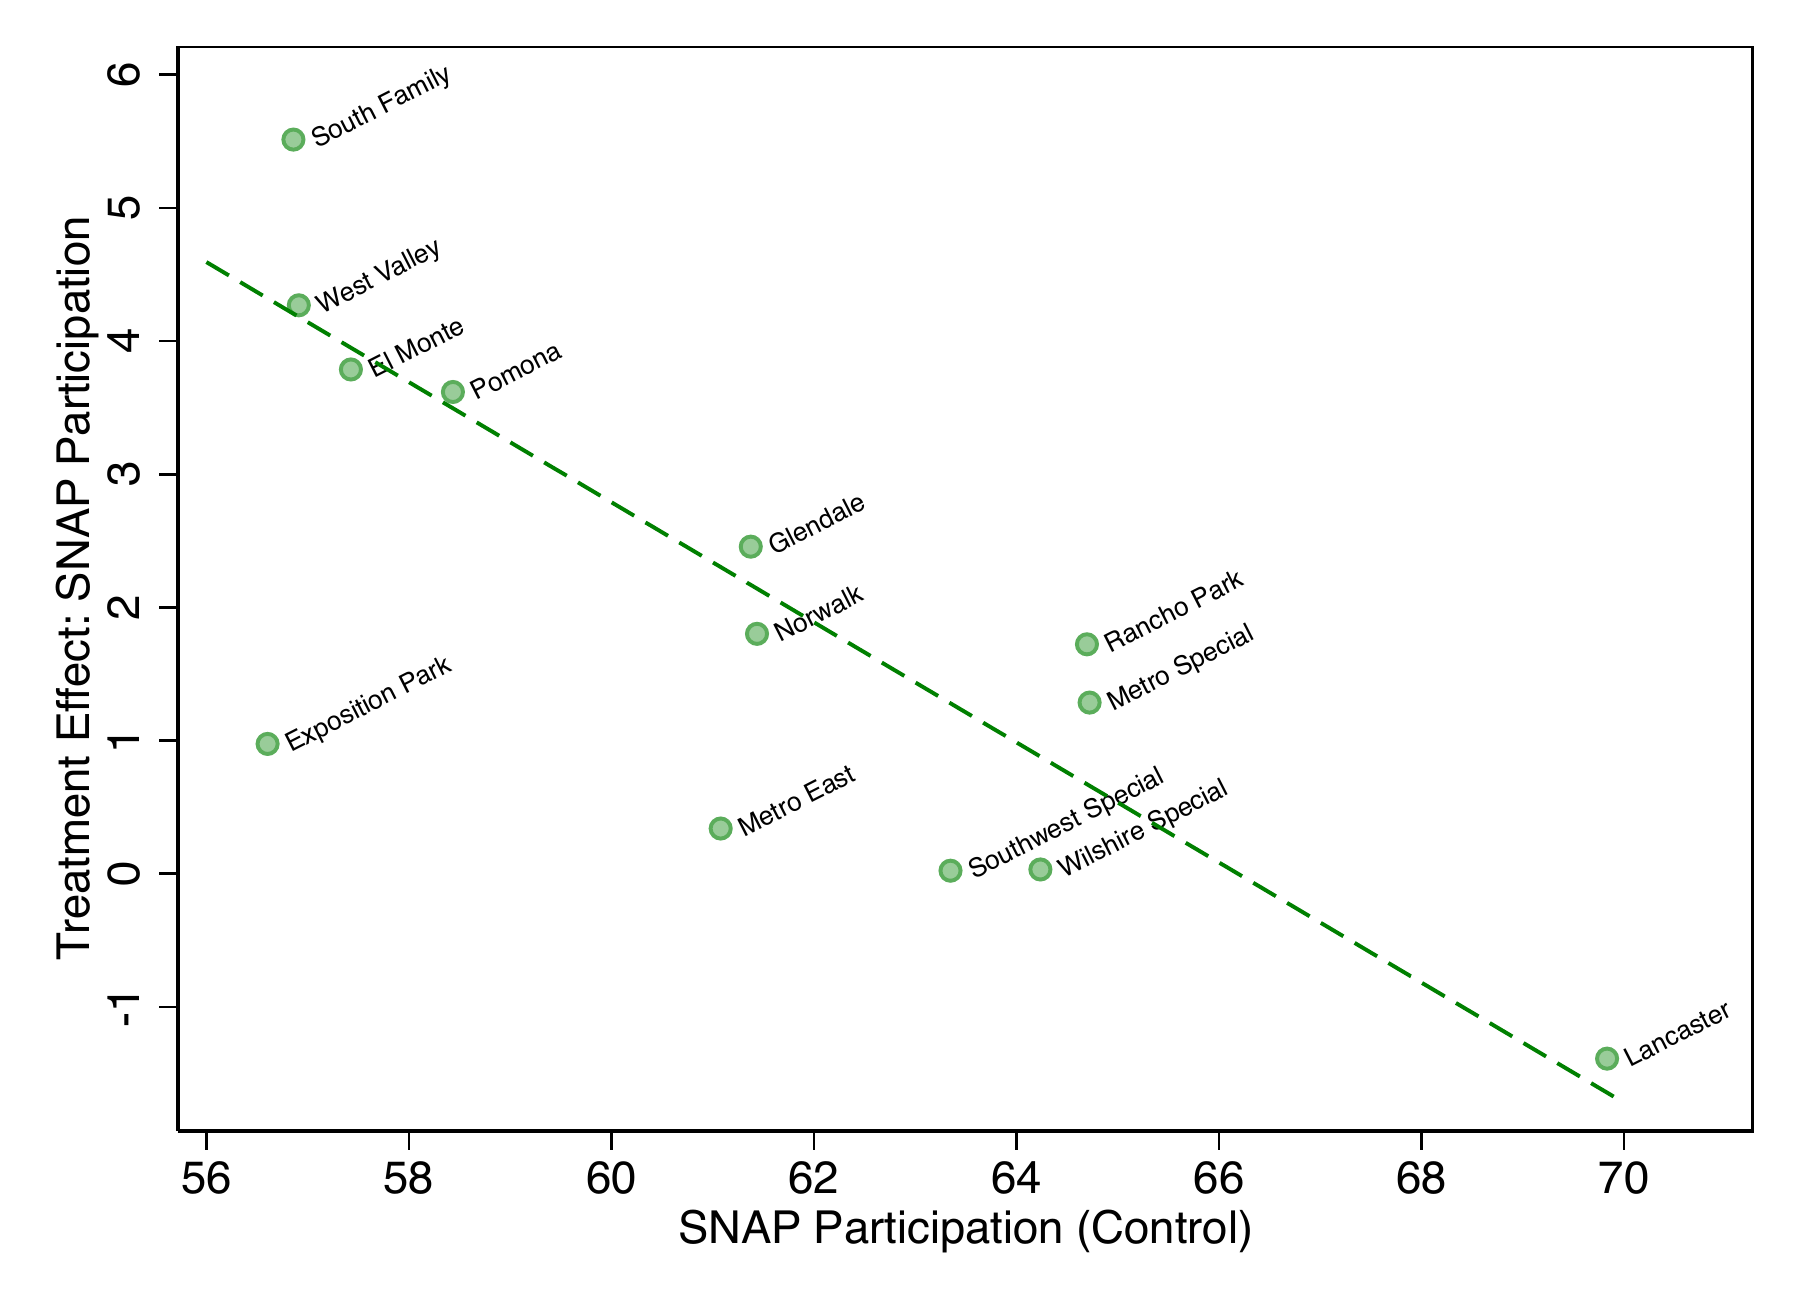
We also explore heterogeneity by SNAP office. SNAP applications in Los Angeles are processed across over 30 separate offices. With the expansion of the E2E line, interviews for applicants from all over the county are processed through the same centralized system. Appendix Table [A.8](#tab:estimates_by_office) presents estimates of the effect of the intervention on participation rates by office. We find substantial variation in the treatment effect sizes with some offices experiencing increases in long-term participation of almost 6 percentage points, and others seeing no increase at all. Appendix Figure [A.5](#fig:office_150) plots our office-level treatment effects against the overall participation rate in the control group. We find a strong negative association between the control group participation rate and the estimated treatment effect, suggesting that our intervention may help minimize disparities across local offices.
## Conclusion
We find that providing SNAP applicants access to flexible intake interviews increases program participation and expedites time to approval resulting in substantial benefit dollars for the marginal enrollee. We find no evidence that this policy change worsens targeting or program integrity.
It is worth noting that our intervention design layers the option of unscheduled interviews initiated by the applicant over the existing scheduled interview process rather than replacing it. Therefore, while our results suggest that access to these flexible interviews increases benefit take-up with minimal additional costs, we cannot assess relative effectiveness of unscheduled versus scheduled interviews. Furthermore, our intervention was conducted during a global pandemic, potentially raising concerns about external validity. On the one hand, this highlights the importance of our research design: our experimental design allows us to disentangle the effects of our intervention from the many other economic changes that were occurring at this time. On the other, it is possible that the applicants in our sample, and the context in which they were applying, may not be representative of the typical SNAP application experience in ways that could possibly interact with the intervention.
Our findings have direct implications for the many government programs that rely on interviews for eligibility screening. One potential policy implication is to remove the intake interview altogether based on our findings that the interview presents a barrier to enrollment for certain cases. However, recent findings suggest that removing personal assistance from the application process leads to a lower tolerance for application errors and decreases overall participation (Wu and Meyer 2022). Taken together, this may explain why prior studies find that eliminating the interview had no effect on the approval rate (Rowe et al. 2015): interviews create additional administrative burden for certain cases, but removing them may generate additional procedural denials among more complicated eligibility determinations.
More broadly, our findings highlight the importance of incorporating flexibility and client autonomy into the design of application processes. At the same time, it is important to recognize the performance incentives faced by program administrators: states are incentivized to contain program costs through financial penalties for persistently high improper payment rates, yet no similar incentives exist to minimize procedural denials. This highlights the complexity of designing program eligibility processes that simultaneously reduce administrative burdens and also minimize program error rates. This underscores a need for broader innovations to eligibility determination, such as adjunctive eligibility or use of third-party information sources.
**Figure 1. Pre-Intervention Applications Outcomes**
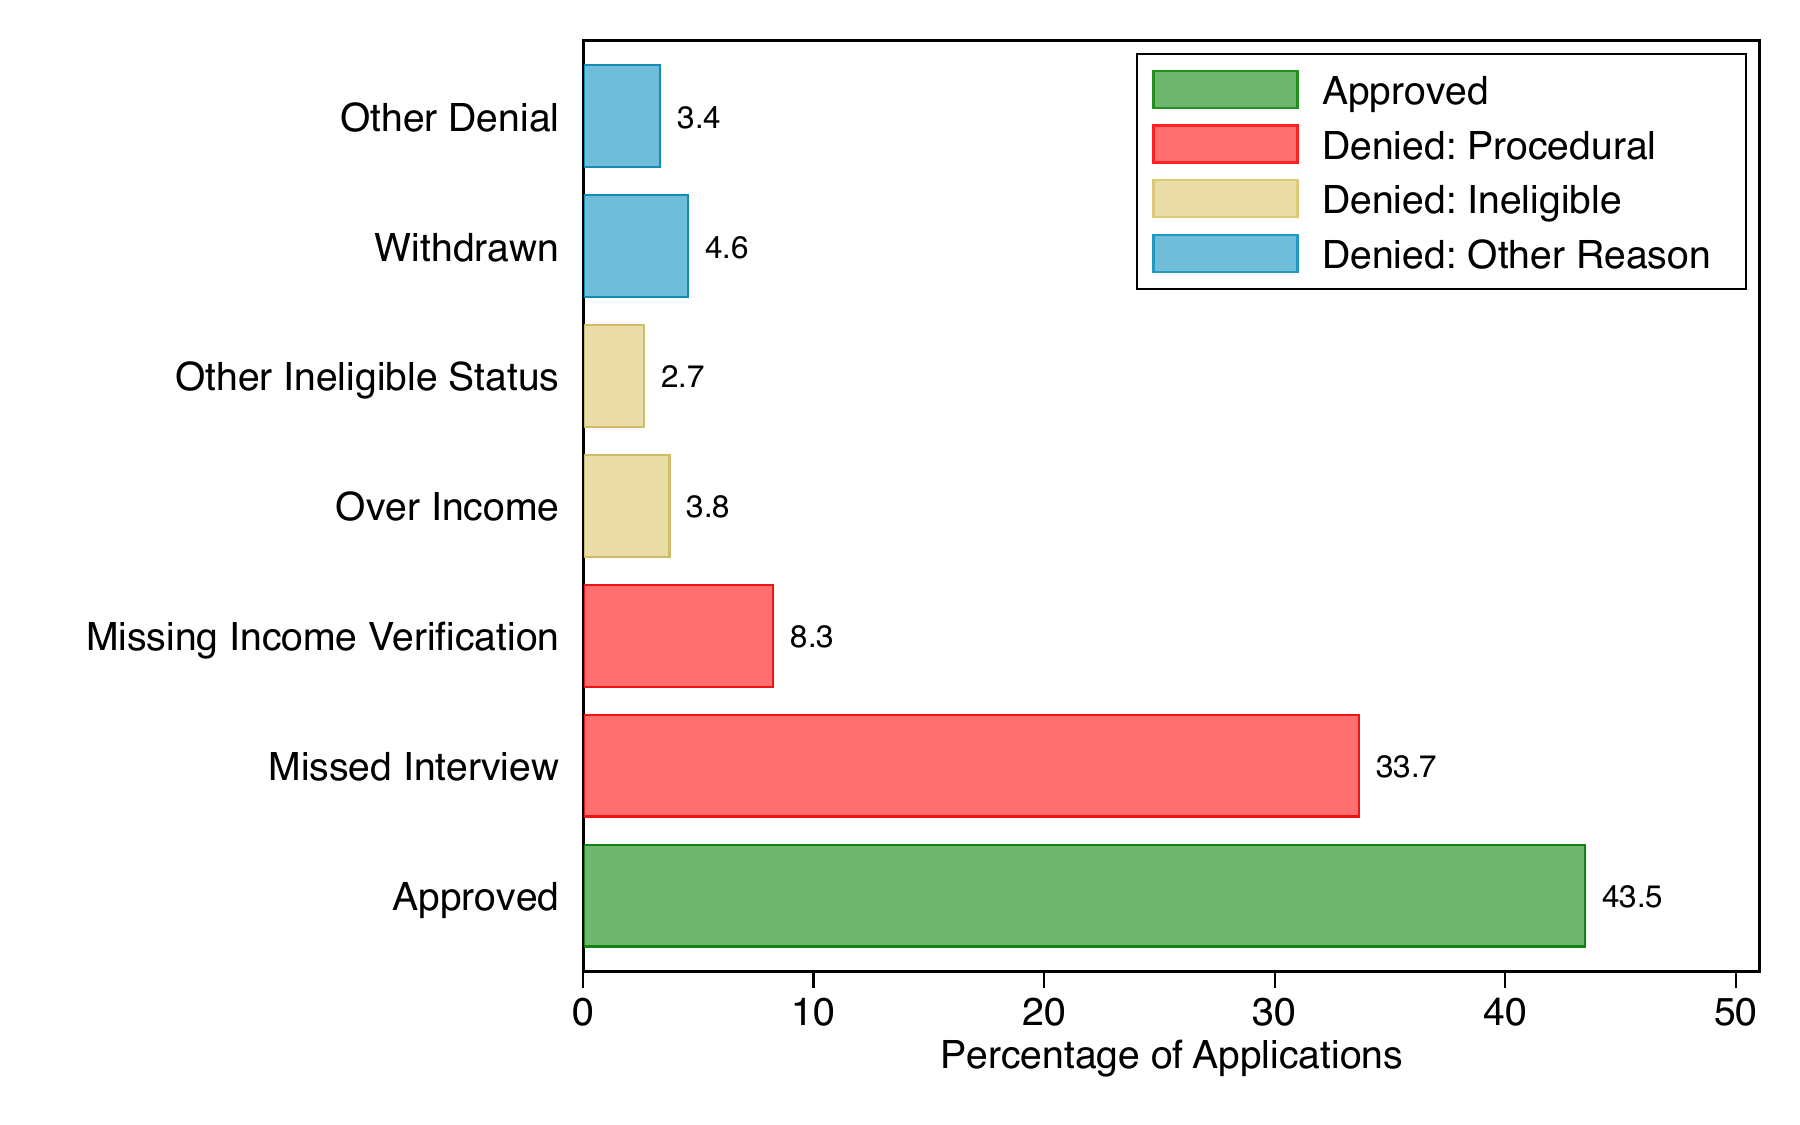
Notes: Outcomes and denial codes for all GetCalFresh applications submitted to Los Angeles County between October 8, 2018 and May 15, 2019.
**Figure 2. The Effect of the Intervention on SNAP Approval Rates**
**A Raw Approval Rates**
**B Treatment Effects**
\
Notes: Panel A presents the cumulative application approval rate by days since application submission by experimental group. Panel B presents the estimated intent-to-treat effect of the intervention on SNAP participation by days since application submission. The outcome is an indicator for ever having participated in SNAP by a given day in 5-day intervals through the 30-day application deadline. Control variables include week, day-of-week, and SNAP office fixed effects as well as household characteristics including household size, age, sex, elderly or disabled status, language, income, cash on hand, SSI receipt, stable housing, rent, expedited benefit qualification, and estimated eligibility. Coefficient estimates are reported in percentage points (0-100). Bars denote the 95% confidence interval derived from heteroskedasticity robust standard errors.
**Figure 3. The Effect of the Intervention on Long-Term SNAP Participation**
\
Notes: The figure displays the estimated intent-to-treat effect of the intervention on SNAP participation by days since application submission. The outcome is an indicator for ever having participated in SNAP by a given day in 5-day intervals beginning with the date of the application deadline (30 days since submission) and ending at 150 days post-submission. All specifications include week, day-of-week, and SNAP office fixed effects as well as household characteristics including household size, age, sex, elderly or disabled status, language, income, cash on hand, SSI receipt, stable housing, rent, expedited benefit qualification, and estimated eligibility. Coefficient estimates are reported in percentage points (0-100). Bars denote the 95% confidence interval derived from heteroskedasticity robust standard errors.
**Figure 4. Event Study for Introduction of E2E on SNAP Approval Rates**
**Control Group**
**Treatment Group**
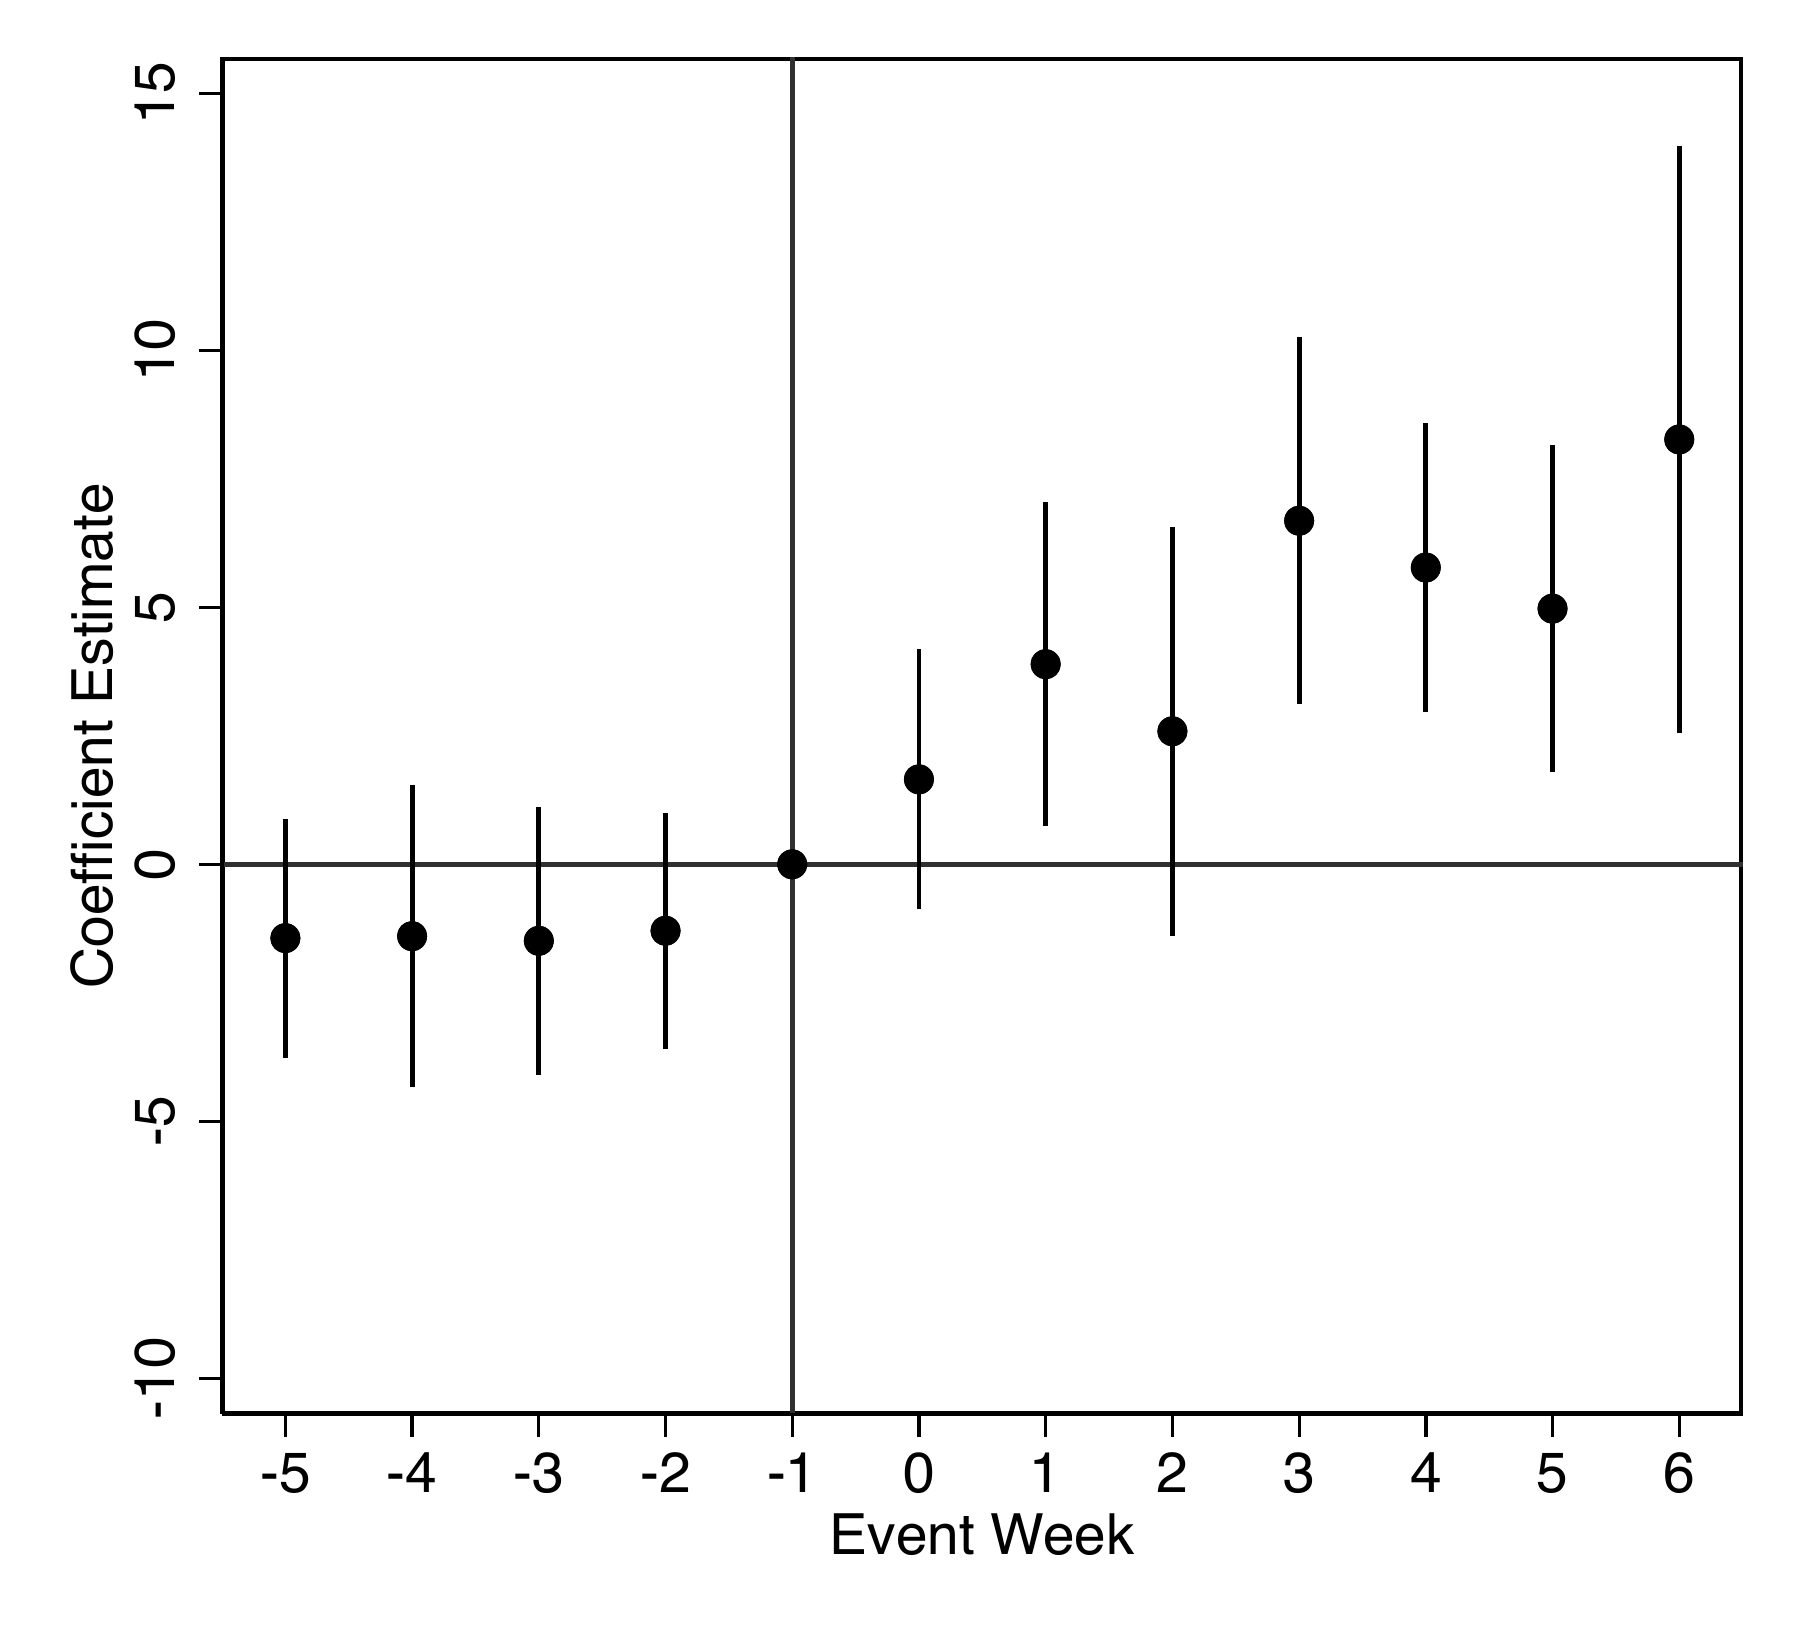\
Notes: The figure presents an event study estimating the effect of E2E introduction on application approval rates using office-level roll-out. Panel A estimates effects on control group members and Panel B estimates effects on treatment group members. Data include all GetCalFresh applications between August 1, 2020 and May 15, 2021. Coefficient estimates are reported in percentage points (0-100). Bars denote the 95% confidence interval. Standard errors are clustered by office.
**Figure 5. Response to Unexpected Increase in Demand**
**(a) Call Volume and Wait Times**
\
**(b) Treatment Effect on Approval Rate by Intervention Week**
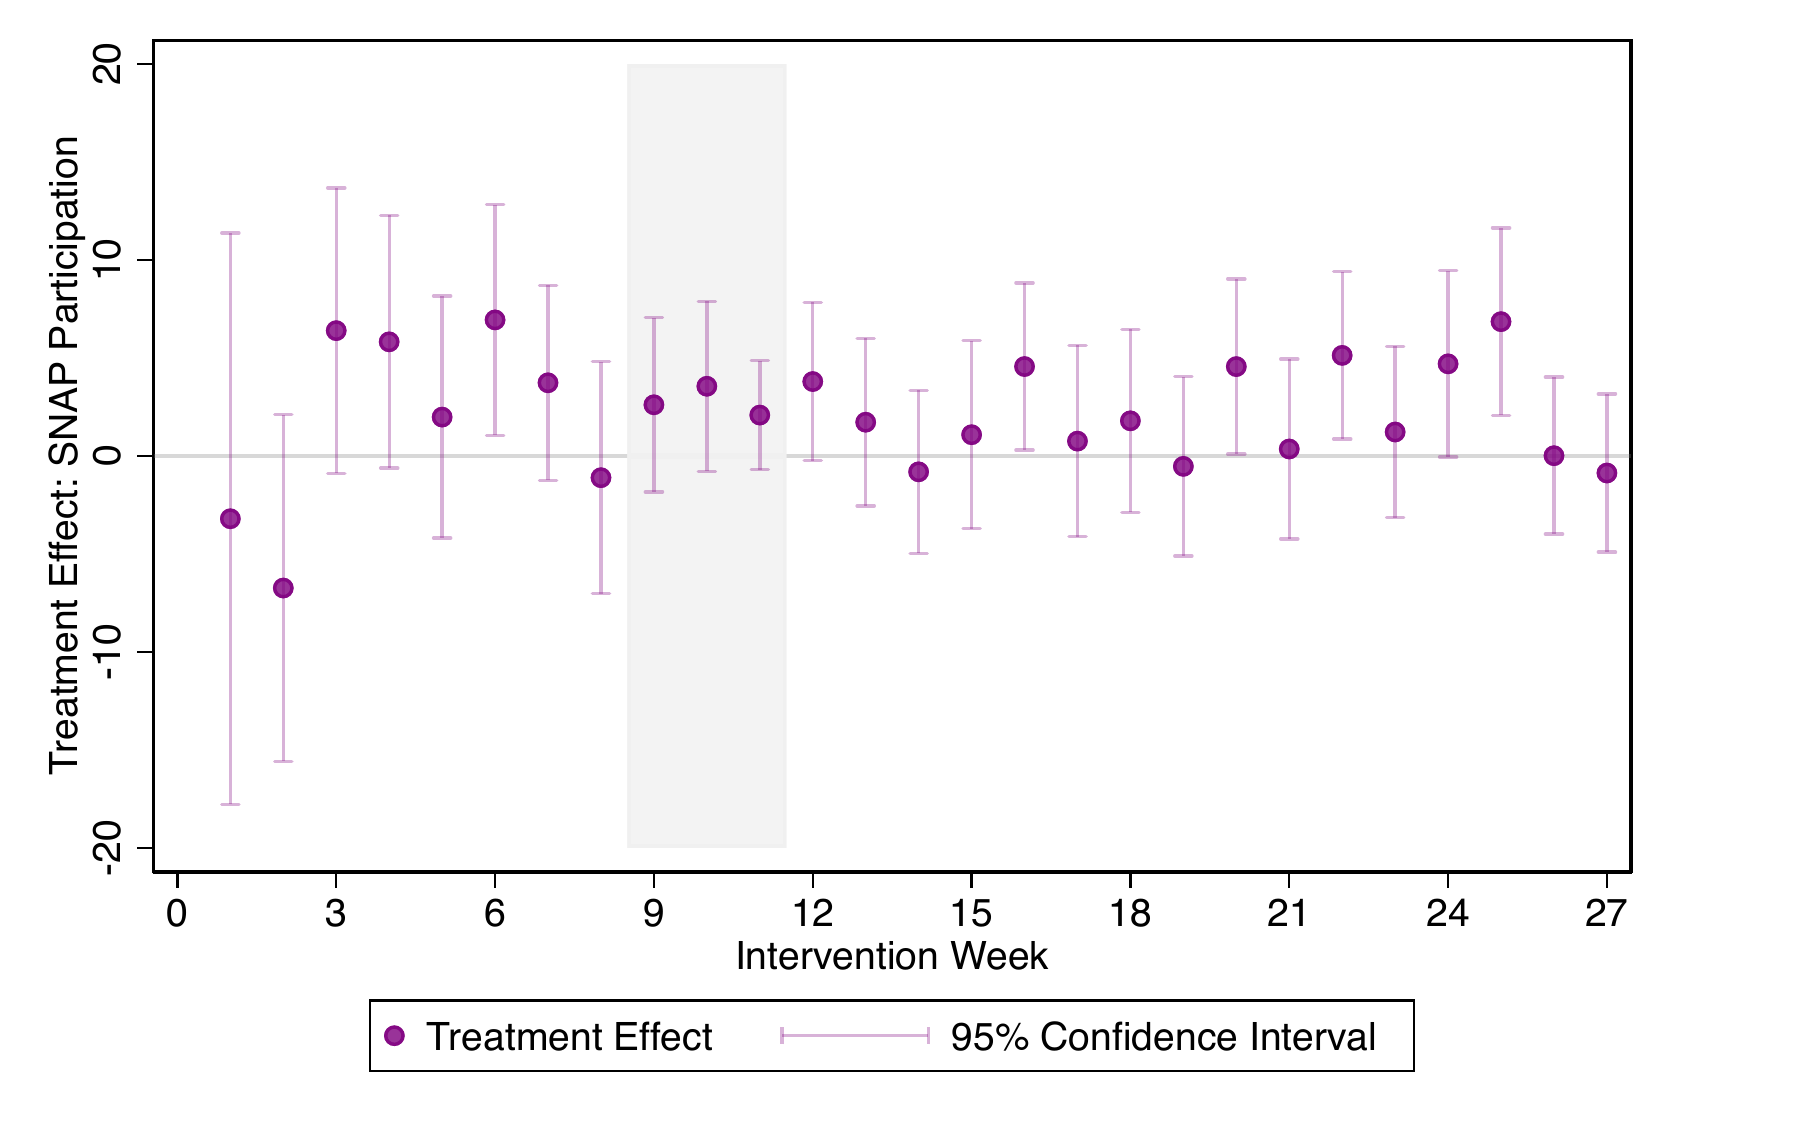\
Notes: Panel A presents the number of calls to the E2E line and the average wait time by intervention week. Panel B presents the estimated intent-to-treat effect of the intervention on SNAP participation by application submission week. Week 1 is the first week of the intervention which started on October 6, 2020. Weeks 9 through 11 (shaded in gray) are the weeks surrounding the date on which pandemic Unemployment Insurance expansions were set to expire (December 26, 2020), though these expansions were ultimately extended. The outcome is an indicator for ever having participated in SNAP within 150 days of application submission. Coefficient estimates are reported in percentage points (0-100). Figures exclude the last 5 weeks of the intervention for which we do not have call volume data. Bars denote the 95% confidence interval derived from heteroskedasticity robust standard errors.
**Table 1. Treatment and Control Group Messages**
| **Treatment** | **Control** |
| --- | --- |
| \[Name\], the county has received your application! You can complete your interview by calling xxx-xxx-xxxx. Hours: M-F 7:30am-7:30pm, Sat 8:00am-4:30pm. The sooner you complete your interview, the sooner you may get your benefits. | Hi \[Name\], We sent your CalFresh application to Los Angeles County! Your county should call you within 10 days for your interview. The call may come from a blocked/unlisted phone number. Make sure to pick up ALL calls. |
\
Notes: This figure presents the text included in the electronic communications sent via GetCalFresh by experimental group. “xxx-xxx-xxxx” is replaced by a unique virtual phone number for each applicant in our treatment message.
**Table 2. Sample Characteristics and Balance Test**
| | Overall | Treatment | Control | $p-$value |
| --- | --- | --- | --- | --- |
| Household Size | 1.70 | 1.71 | 1.68 | 0.002 |
| Submitter Age (in years) | 37.45 | 37.47 | 37.40 | 0.657 |
| Submitter Female (%) | 59.55 | 59.69 | 59.11 | 0.192 |
| Elderly or Disabled (%) | 16.96 | 17.02 | 16.79 | 0.510 |
| English (%) | 85.51 | 85.44 | 85.75 | 0.331 |
| Any Income in Past 30 Days (%) | 44.74 | 44.78 | 44.62 | 0.711 |
| Income Past 30 Days (\$) | 709.07 | 710.79 | 703.95 | 0.499 |
| Any Money on Hand (%) | 55.38 | 55.32 | 55.55 | 0.616 |
| Money on Hand (\$) | 1004.06 | 1006.43 | 996.96 | 0.896 |
| Has Non-Job Income (%) | 16.71 | 16.72 | 16.66 | 0.857 |
| Receives SSI (%) | 10.13 | 10.24 | 9.79 | 0.103 |
| Stable Housing (%) | 59.63 | 59.76 | 59.24 | 0.248 |
| Rent or Mortgage (\$) | 768.42 | 767.77 | 770.37 | 0.909 |
| Expedited (%) | 52.60 | 52.47 | 52.98 | 0.257 |
| Estimated Eligible (%) | 90.47 | 90.44 | 90.56 | 0.663 |
| Joint Significance Test | $F$ = 0.96 | $F$ = 0.96 | $F$ = 0.96 | 0.49 |
| Observations | 64798 | 48557 | 16241 | |
Notes: This table presents summary statistics of the baseline characteristics included in the submitted applications for the full sample (column 1), the treatment group (column 2), and the control group (column 3). Column 4 presents the p-value associated with a test for equality of means from columns 2 and 3. These application characteristics include: household size, age and sex of the application submitter, whether the household contains an elderly or disabled member, whether the case language is English, income in the last 30 days (indicator and dollar amount), any cash on hand (indicator and dollar amount), an indicator for non-job income, whether the household receives SSI, an indicator for being in stable housing, and an estimate of monthly rent. From the information included in the self-reported application, GetCalFresh estimates whether the applicant appears eligible for SNAP and if they qualify for expedited (emergency) benefits. The joint significant test reports the $F$-statistic from a regression of treatment status on all case characteristics listed in the table.
**Table 3. Summary Statistics: Calls Data**
| | Treatment | Control | Overall | $p-$value |
| --- | --- | --- | --- | --- |
| **Individual Data** | | | | |
| % Ever called | 53.00 | 0.48 | | 0.00 |
| % Ever called (over 5 minutes) | 46.20 | 0.42 | | 0.00 |
| *Among Callers* | | | | |
| Number of calls | 1.79 | | | |
| Longest call (minutes) | 31.65 | | | |
| Total minutes on E2E call | 37.49 | | | |
| **County-Level Data** | | | | |
| Average call time (minutes) | | | 20.23 | |
| Average wait time (minutes) | | | 2.46 | |
| Observations | 48557 | 16241 | | |
Notes: This table presents summary statistics regarding calls to the E2E line. Individual-level statistics on call rates are presented separately for treatment group (column 1) versus control group (column 2) members along with the p-value associated with a test for equality between the two means (column 4). The table also includes statistics on the number of calls and average call length among treated callers and county-level statistics on average call and wait times (column 3).
**Table 4. Summary Statistics for Compliers and Potential Compliers**
| | \(1\) | \(2\) |
| --- | --- | --- |
| | Compliers | Potential Compliers |
| Household Size | 1.68 | 1.68 |
| | (0.01) | \[0.799\] |
| Applicant Age (in years) | 37.62 | 37.40 |
| | (0.09) | \[0.154\] |
| Applicant Female (%) | 59.55 | 59.17 |
| | (0.32) | \[0.412\] |
| Elderly or Disabled (%) | 16.06 | 16.75 |
| | (0.24) | \[0.050\] |
| English (%) | 85.41 | 85.74 |
| | (0.22) | \[0.324\] |
| Any Income Past 30 Days (%) | 42.83 | 44.63 |
| | (0.31) | \[0.000\] |
| Income in Past 30 Days (\$) | 656.84 | 704.67 |
| | (7.09) | \[0.000\] |
| Any Money on Hand (%) | 55.17 | 55.54 |
| | (0.31) | \[0.434\] |
| Money on Hand (\$) | 1084.71 | 996.25 |
| | (53.57) | \[0.282\] |
| Has Non-Job Income (%) | 16.90 | 16.66 |
| | (0.24) | \[0.495\] |
| SSI (%) | 9.54 | 9.77 |
| | (0.19) | \[0.421\] |
| Stable Housing (%) | 60.77 | 59.27 |
| | (0.32) | \[0.001\] |
| Rent or Mortgage (\$) | 792.46 | 770.61 |
| | (15.97) | \[0.395\] |
| Expedited (%) | 55.75 | 52.98 |
| | (0.31) | \[0.000\] |
| Estimated Eligible (%) | 91.72 | 90.55 |
| | (0.18) | \[0.000\] |
| Sample Share | 52.60 | 24.69 |
| | (0.23) | |
\
Notes: This table presents summary statistics of baseline characteristics included in the submitted application for compliers (column 1) and potential compliers (column 2). Potential compliers are applicants in the control group who did not call the E2E line. The covariate means for the compliers are calculated using the approach in (Marbach and Hangartner 2020). Bootstrapped standard errors are reported in parentheses and $p$-values from a t-test of whether the complier mean is equal to that of potential compliers are reported in brackets. Application characteristics include: household size, age and sex of the application submitter, whether the household contains an elderly or disabled member, case language, income in the last 30 days (indicator and dollar amount), any cash on hand (indicator and dollar amount), an indicator for non-job income, whether the household receives SSI, an indicator for being in stable housing, and an estimate of monthly rent. From the information included in the self-reported application, GetCalFresh estimates whether the applicant appears eligible for SNAP and if they qualify for expedited (emergency) benefits.
**Table 5. Effect of Intervention on SNAP Participation Outcomes**
| | | | Approved by Day | Approved by Day | Approved by Day | Approved by Day | Approved by Day |
| --- | --- | --- | --- | --- | --- | --- | --- |
| | Approval Rate | Days to Determination | Day 5 | Day 10 | Day 15 | Day 20 | Day 25 |
| | (1) | (2) | (3) | (4) | (5) | (6) | (7) |
| | **Panel A: Intent to Treat** | **Panel A: Intent to Treat** | **Panel A: Intent to Treat** | **Panel A: Intent to Treat** | **Panel A: Intent to Treat** | **Panel A: Intent to Treat** | **Panel A: Intent to Treat** |
| Treatment | 6.23 | -4.15 | 13.90 | 12.13 | 10.73 | 9.14 | 7.92 |
| | (0.43) | (0.13) | (0.33) | (0.39) | (0.41) | (0.42) | (0.43) |
| | **Panel B: Instrument Calls with Treatment Status** | **Panel B: Instrument Calls with Treatment Status** | **Panel B: Instrument Calls with Treatment Status** | **Panel B: Instrument Calls with Treatment Status** | **Panel B: Instrument Calls with Treatment Status** | **Panel B: Instrument Calls with Treatment Status** | **Panel B: Instrument Calls with Treatment Status** |
| Called E2E | 11.86 | -7.90 | 26.47 | 23.11 | 20.44 | 17.41 | 15.09 |
| | (0.82) | (0.24) | (0.62) | (0.74) | (0.77) | (0.80) | (0.81) |
| Control Group Mean | 48.73 | 20.99 | 13.66 | 25.96 | 32.68 | 37.89 | 42.28 |
| Complier Mean | 63.28 | 14.84 | 33.26 | 45.13 | 50.70 | 54.83 | 58.20 |
| Observations | 64,126 | 64,126 | 64,126 | 64,126 | 64,126 | 64,126 | 64,126 |
Notes: The table reports the estimated effect of the intervention on application approval rates and timeliness. Outcomes include an indicator for being approved by the 30-day deadline (column 1), number of days before an application received a determination (column 2), and indicators for application approvals within the given number of days since submission in 5-day increments (columns 3-7). Panel A presents intent-to-treat estimates. Panel B presents estimates derived from a two-stage least-squares specification in which an indicator for calling the E2E line is instrumented for by an indicator for treatment status. All specifications include week, day-of-week, and SNAP office fixed effects as well as household characteristics including household size, age, sex, elderly or disabled status, language, income, cash on hand, SSI receipt, stable housing, rent, expedited benefit qualification, and estimated eligibility. Coefficient estimates are reported in days for column 2 and in percentage points (0-100) for all other columns. Parentheses contain heteroskedasticity robust standard errors.
**Table 6. Effect of Intervention on Long-Term SNAP Participation**
| | Approved by Day | Approved by Day | Approved by Day | Approved by Day |
| --- | --- | --- | --- | --- |
| | Day 60 | Day 90 | Day 120 | Day 150 |
| | (1) | (2) | (3) | (4) |
| | **Panel A: Intent to Treat** | **Panel A: Intent to Treat** | **Panel A: Intent to Treat** | **Panel A: Intent to Treat** |
| Treatment | 2.91 | 2.48 | 2.27 | 2.19 |
| | (0.43) | (0.43) | (0.42) | (0.42) |
| | **Panel B: Instrument Calls with Treatment Status** | **Panel B: Instrument Calls with Treatment Status** | **Panel B: Instrument Calls with Treatment Status** | **Panel B: Instrument Calls with Treatment Status** |
| Called E2E | 5.54 | 4.73 | 4.33 | 4.16 |
| | (0.81) | (0.81) | (0.81) | (0.80) |
| Control Group Mean | 58.33 | 60.05 | 60.84 | 61.47 |
| Complier Mean | 69.85 | 71.07 | 71.60 | 72.02 |
| Observations | 64,126 | 64,126 | 64,126 | 64,126 |
Notes: The table reports the estimated effect of the intervention on longer-term SNAP participation. Outcomes include indicators for being approved by days 60, 90, 120, and 150 (columns 1-4, respectively). Panel A presents intent-to-treat estimates. Panel B presents estimates derived from a two-stage least-squares specification in which an indicator for calling the E2E line is instrumented for by an indicator for treatment status. All specifications include week, day-of-week, and SNAP office fixed effects as well as household characteristics including household size, age, sex, elderly or disabled status, language, income, cash on hand, SSI receipt, stable housing, rent, expedited benefit qualification, and estimated eligibility. Coefficient estimates are reported in percentage points (0-100). Parentheses contain heteroskedasticity robust standard errors.
**Table 7. Effect of Intervention on Benefit Dollars Received**
| | \(1\) | \(2\) | \(3\) |
| --- | --- | --- | --- |
| Treated | 15.68 | | |
| | (1.63) | | |
| Called E2E | | 29.81 | |
| | | (3.08) | |
| SNAP Months | | | 374.63 |
| | | | (20.06) |
| Observations | 64,126 | 64,126 | 64,126 |
Notes: The table reports the estimated effect of the intervention on SNAP benefit receipt. The outcome is an estimate of the average benefits received over the five months following the initial application submission per month (columns 1 and 2) and overall (column 3). Benefit amounts are estimated based on household size and the statutory maximum benefit amounts on the date of application. Column 1 presents intent-to-treat estimates. Column 2 presents estimates derived from a two-stage least-squares specification in which an indicator for calling the E2E line is instrumented for by an indicator for treatment status. Column 3 instruments for the number of months receiving SNAP within 150 days of application submission with treatment status. All specifications include week, day-of-week, and SNAP office fixed effects as well as household characteristics including household size, age, sex, elderly or disabled status, language, income, cash on hand, SSI receipt, stable housing, rent, expedited benefit qualification, and estimated eligibility. Coefficient estimates are reported in dollars. Parentheses contain heteroskedasticity robust standard errors.
**Table 8. Treatment Effects by Subgroup: Long-term SNAP Participation**
| | \(1\) | \(2\) | \(3\) | \(4\) | \(5\) | \(6\) | \(7\) | \(8\) | \(9\) |
| --- | --- | --- | --- | --- | --- | --- | --- | --- | --- |
| Treated (T) | 1.08 | 2.26 | 2.32 | 2.27 | 2.42 | 1.36 | 2.47 | -1.18 | -2.44 |
| | (0.61) | (0.56) | (0.63) | (0.52) | (0.67) | (1.17) | (0.45) | (1.36) | (2.15) |
| T\*Expedited | 2.10 | | | | | | | | 1.77 |
| | (0.85) | | | | | | | | (0.99) |
| T\*Any Income | | -0.17 | | | | | | | 0.59 |
| | | (0.86) | | | | | | | (1.20) |
| T\*Any Money on Hand | | | -0.25 | | | | | | 0.25 |
| | | | (0.85) | | | | | | (0.91) |
| T\*Has Job | | | | -0.18 | | | | | -0.09 |
| | | | | (0.90) | | | | | (1.25) |
| T\*Stable Housing | | | | | -0.40 | | | | 0.07 |
| | | | | | (0.86) | | | | (0.93) |
| T\*English | | | | | | 0.95 | | | 0.87 |
| | | | | | | (1.26) | | | (1.31) |
| T\*SSI | | | | | | | -2.87 | | -2.37 |
| | | | | | | | (1.24) | | (1.33) |
| T\*Eligible | | | | | | | | 3.72 | 3.08 |
| | | | | | | | | (1.43) | (1.49) |
| Control Group Mean | 61.47 | 61.47 | 61.47 | 61.47 | 61.47 | 61.47 | 61.47 | 61.47 | 61.47 |
| Observations | 64,126 | 64,126 | 64,126 | 64,126 | 64,126 | 64,126 | 64,126 | 64,126 | 64,126 |
\
Notes: The table reports the estimated effect of the intervention on long-term SNAP participation by subgroups based on application characteristics. The outcome variable is an indicator for every receiving SNAP within 150 days of application submission. Subgroups include: expedited benefit qualification (column 1), any income in the 30 days (column 2), any cash on hand (column 3), employed (column 4), lives in stable housing (column 5), receives SSI (column 6), and estimated eligible for SNAP based on application characteristics (column 7). Column 8 includes all seven interactions. All specifications include week, day-of-week, and SNAP office fixed effects as well as household characteristics including household size, age and sex of the application submitter, whether the household contains an elderly or disabled member, case language, income in the last 30 days (indicator and dollar amount), any cash on hand (indicator and dollar amount), an indicator for non-job income, whether the household receives SSI, an indicator for being in stable housing, monthly rent, expedited benefit qualification, and estimated eligibility. Coefficient estimates are reported in percentage points (0-100). Parentheses contain heteroskedasticity robust standard errors.
**Appendix**
## Appendix A. Additional Figures and Tables
**Figure A.1. Los Angeles SNAP Applications by Method**
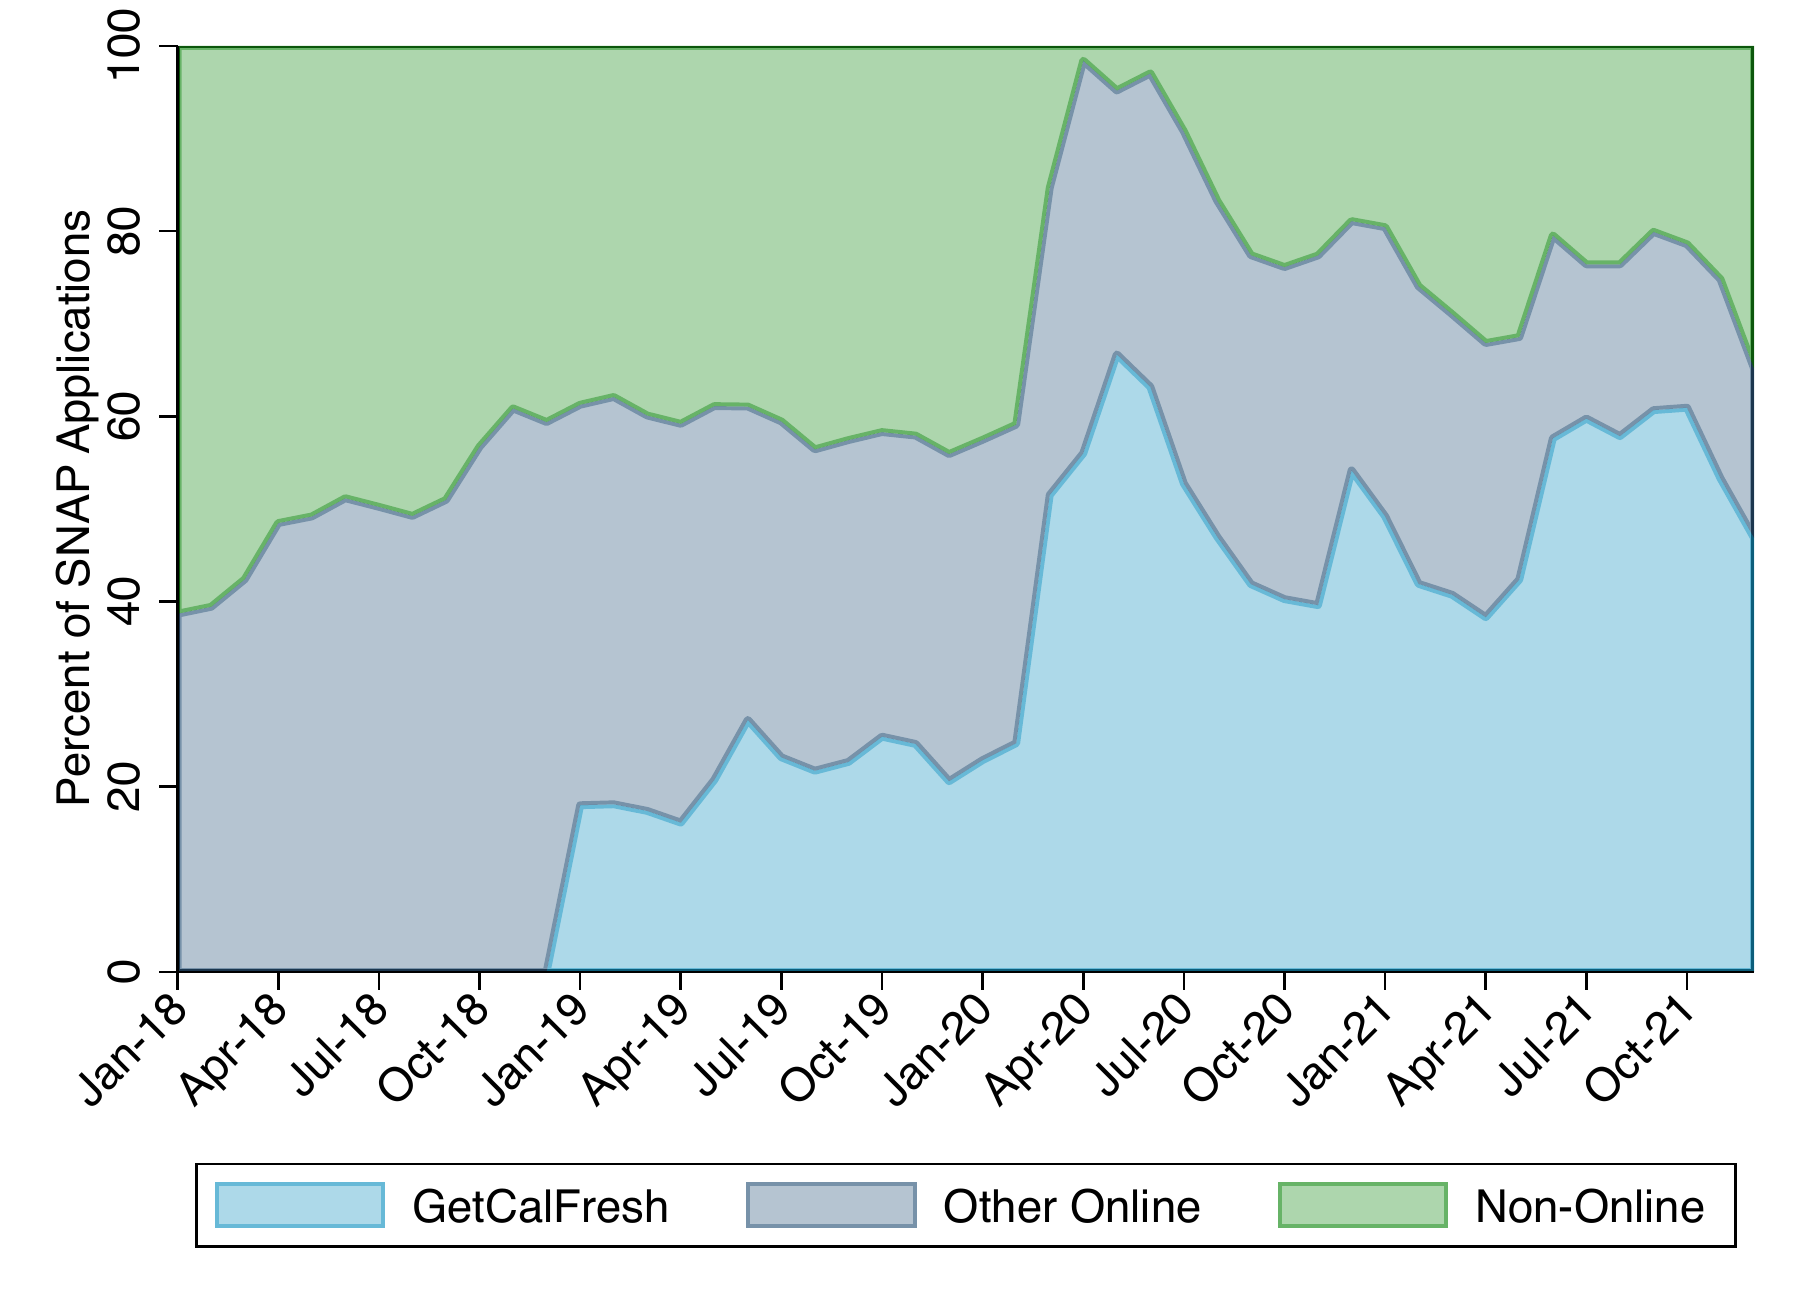
Notes: This figure presents the fraction of SNAP applications in Los Angeles County over time that are submitted through GetCalFresh, other online portals, or non-online methods, respectively.
**Figure A.2. CalFresh Initial Appointment Letter (CF-29A)**

**Figure A.3. Number of Participating Offices Over Time**
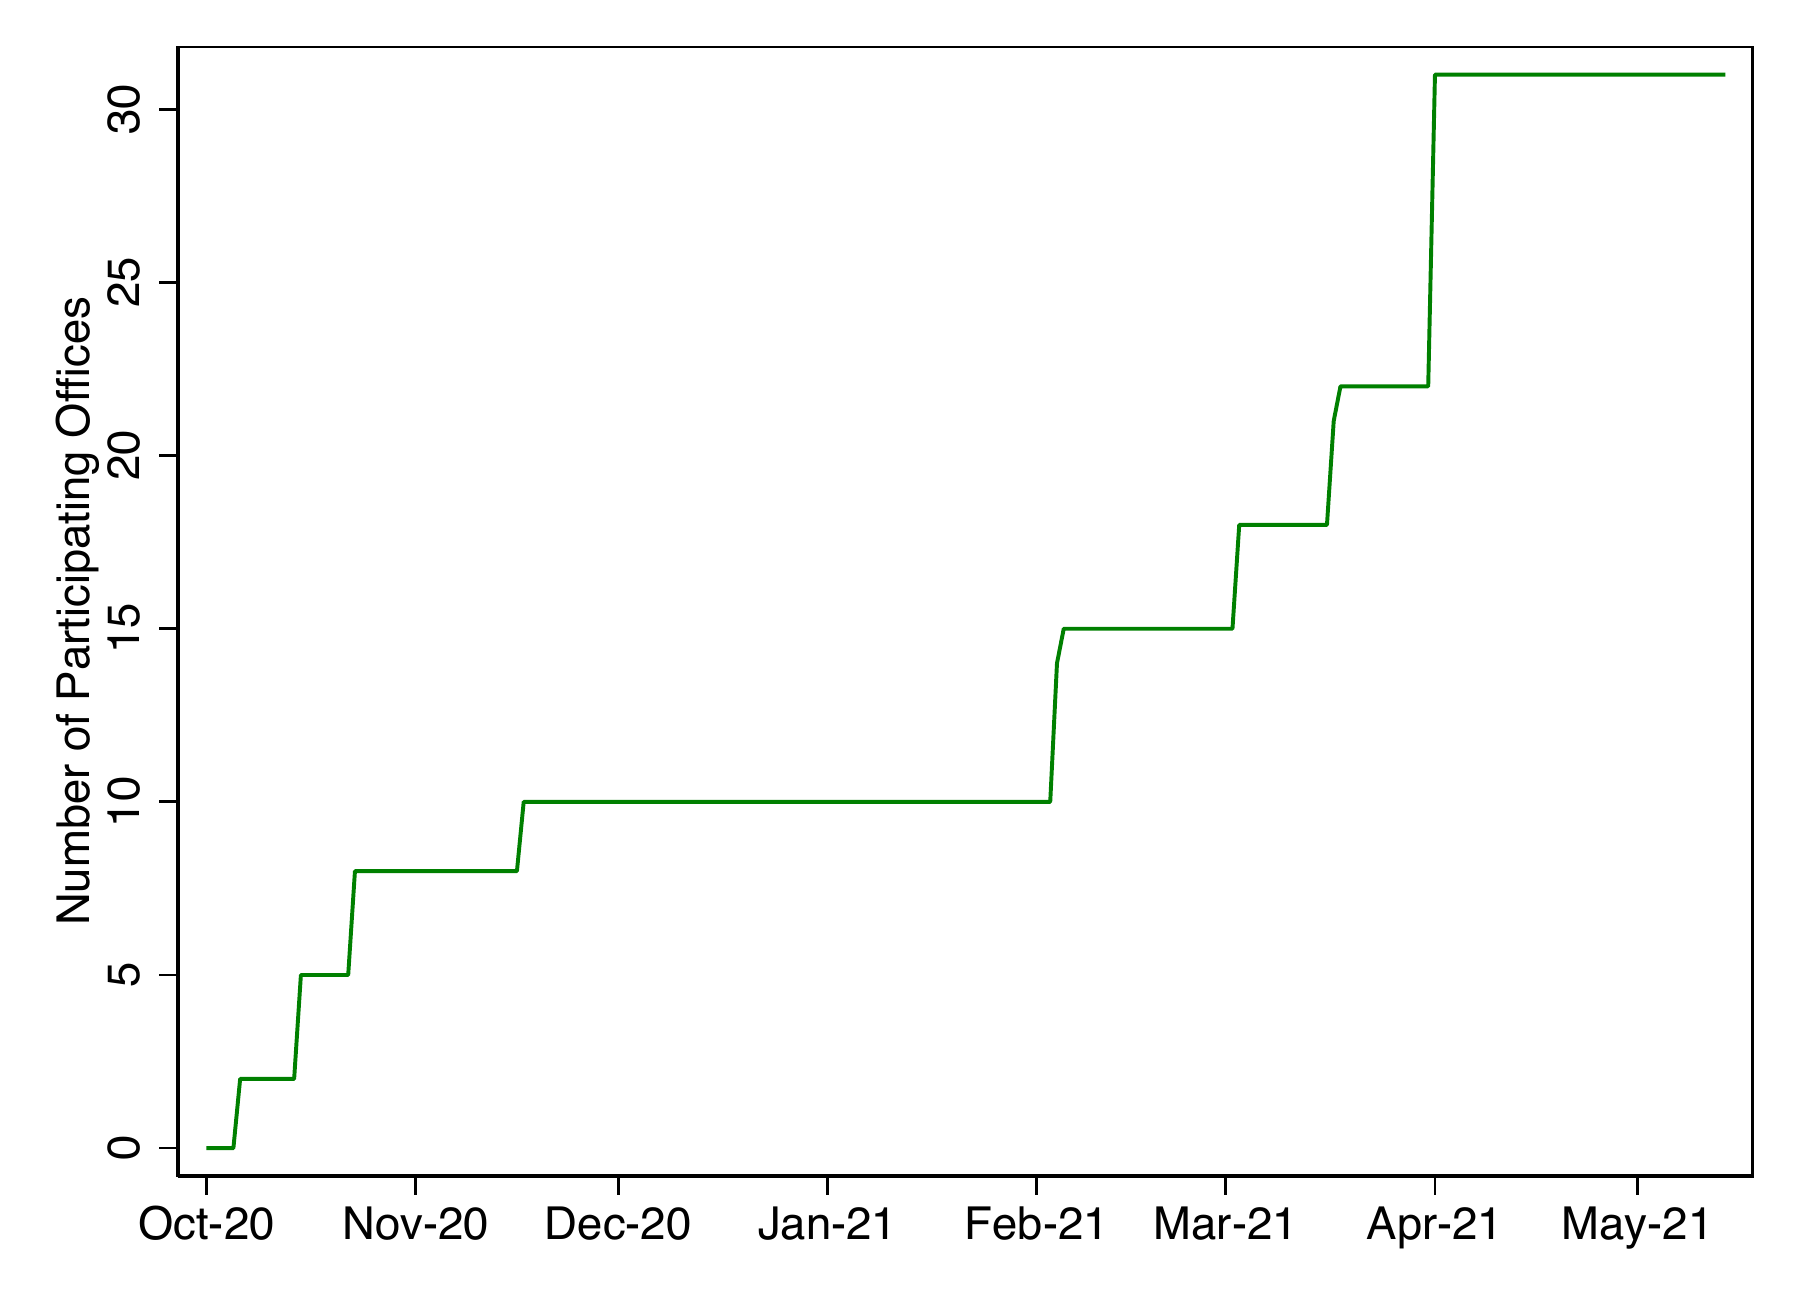 \
Notes: This figure presents the number of SNAP offices included in the experiment over time.
**Figure A.4. Ever Called E2E by Days Since Application**
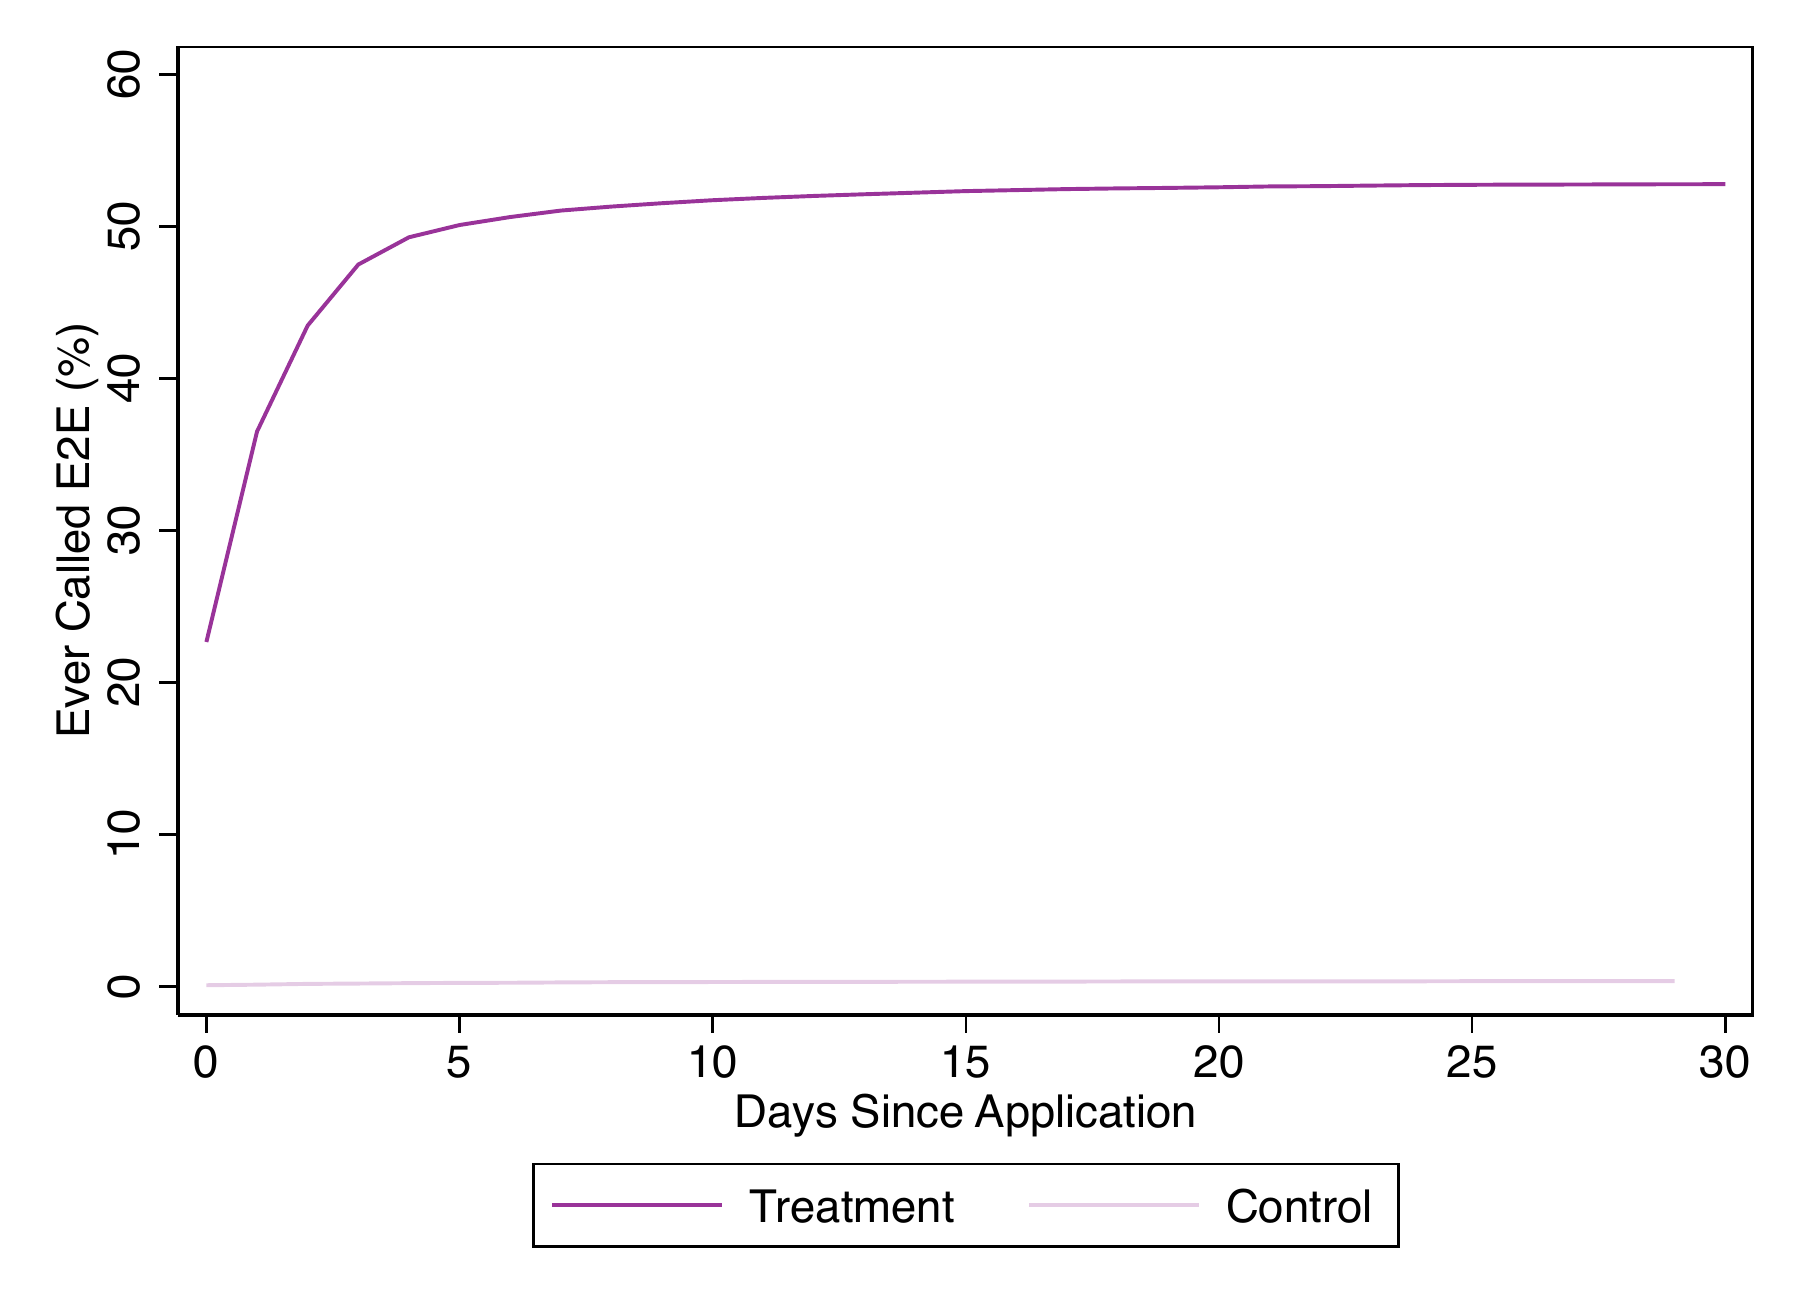
Notes: This figure presents the fraction of applicants who had ever called the E2E line by days since initial application submission separately for treatment and control groups.
**Figure A.5. Long-term SNAP Participation: Treatment Effect vs. Baseline Rate by Office**
\
Notes: This figure plots the coefficient estimating the effect of the intervention on ever receiving SNAP in the 150 days post-application submission (y-axis) versus the control mean for the same outcome (x-axis) for each SNAP office. Analysis excludes offices with fewer than 1,000 observations.
**Table A.1. Pre-Intervention Application Outcomes by Subgroup**
| | \(1\) | \(2\) | \(3\) | \(4\) | \(5\) | \(6\) | \(7\) |
| --- | --- | --- | --- | --- | --- | --- | --- |
| | Approved | Missed Interview | Missing Income Verification | Over Income | Other Ineligible | Withdrawn | Other Denial |
| Overall | 43.48 | 33.69 | 8.34 | 3.80 | 2.67 | 4.63 | 3.39 |
| **Expedited** | | | | | | | |
| No | 39.47 | 34.19 | 9.73 | 6.13 | 2.66 | 5.26 | 2.58 |
| Yes | 52.66 | 29.34 | 5.24 | 1.50 | 3.13 | 4.26 | 3.87 |
| **Stable Housing** | | | | | | | |
| No | 48.82 | 33.80 | 5.93 | 1.32 | 2.60 | 4.09 | 3.45 |
| Yes | 40.95 | 33.56 | 9.53 | 5.06 | 2.69 | 4.88 | 3.33 |
| **Has Job** | | | | | | | |
| No | 53.10 | 29.07 | 4.43 | 1.58 | 2.91 | 4.16 | 4.75 |
| Yes | 33.09 | 38.67 | 12.68 | 6.31 | 2.29 | 5.13 | 1.83 |
| **Elderly or Disabled** | | | | | | | |
| No | 43.64 | 33.81 | 8.37 | 3.73 | 2.71 | 4.61 | 3.13 |
| Yes | 41.13 | 26.85 | 6.90 | 7.09 | 0.67 | 4.89 | 12.46 |
| **SSI** | | | | | | | |
| No | 43.74 | 33.93 | 8.52 | 3.77 | 2.76 | 4.67 | 2.62 |
| Yes | 40.02 | 27.16 | 4.38 | 4.82 | 0.50 | 3.60 | 19.51 |
Notes: Outcomes and denial codes for all GetCalFresh applications submitted to Los Angeles County between October 8, 2018 and May 15, 2019. Subgroups include whether the household qualifies for expedited benefits (48% of applications), lives in stable housing (67%), has a job (47%), includes an individual who is elderly or disabled (15%), or receives SSI (4%).
**Table A.2. Treatment and Control Group Reminder Messages**
| **Treatment** | **Control** |
| --- | --- |
| \[Name\], this is a reminder that you can complete your CalFresh interview by calling xxx-xxx-xxxx. Hours: M-F 7:30am-7:30pm, Sat 8:00am-4:30pm. The sooner you complete your interview, the sooner you may get your benefits. | Hi \[Name\], Look out for a phone call or mail about your CalFresh interview. The call may come from a blocked/unlisted phone number. Be sure to answer ALL calls. It’s okay if you haven’t heard from them yet. Los Angeles County DPSS has about 10 business days from when you applied to reach out. If you need to reschedule your interview, call xxx-xxx-xxxx. |
\
Notes: This figure presents the text included in the reminder communications sent via GetCalFresh by experimental group. “xxx-xxx-xxxx” is replaced by a unique virtual phone number for each applicant in our treatment message.
**Table A.3. Treatment Take-Up by Case Characteristics**
| | \(1\) | \(2\) | \(3\) |
| --- | --- | --- | --- |
| | Yes | No | $p$-value |
| Submitter Female (%) | 53.1 | 53.0 | 0.895 |
| Elderly or Disabled (%) | 50.6 | 53.5 | 0.000 |
| English(%) | 52.9 | 53.6 | 0.292 |
| Any Income in Past 30 Days (%) | 50.8 | 54.8 | 0.000 |
| Any Money on Hand (%) | 52.8 | 53.3 | 0.258 |
| Has Non-Job Income (%) | 53.7 | 52.9 | 0.187 |
| Receives SSI (%) | 50.8 | 53.3 | 0.001 |
| Stable Housing (%) | 54.1 | 51.5 | 0.000 |
| Expedited(%) | 56.0 | 49.6 | 0.000 |
| Estimated Eligible (%) | 53.8 | 46.3 | 0.000 |
Notes: This table presents the treatment take-up by case characteristics. Column 1 presents the fraction of treatment group members in the specified subgroup who called the E2E line, while column 2 presents the corresponding take-up rate for treatment members who are not in the subgroup. Column 3 presents the $p$-value associated with a test for equality of means from columns 1 and 2. Case characteristics include: sex of the application submitter, whether the household contains an elderly or disabled member, case language, an indicator for income in the last 30 days, an indicator for any cash on hand, an indicator for non-job income, whether the household receives SSI, an indicator for being in stable housing. From the information included in the self-reported application, GetCalFresh estimates whether the applicant appears eligible for SNAP and if they qualify for expedited (emergency) benefits.
**Table A.4. Effect of Intervention on SNAP Participation Outcomes (No Controls)**
| | | | Approved by Day | Approved by Day | Approved by Day | Approved by Day | Approved by Day |
| --- | --- | --- | --- | --- | --- | --- | --- |
| | Approval Rate | Days to Determination | Day 5 | Day 10 | Day 15 | Day 20 | Day 25 |
| | (1) | (2) | (3) | (4) | (5) | (6) | (7) |
| | **Panel A: Intent to Treat** | **Panel A: Intent to Treat** | **Panel A: Intent to Treat** | **Panel A: Intent to Treat** | **Panel A: Intent to Treat** | **Panel A: Intent to Treat** | **Panel A: Intent to Treat** |
| Treatment | 6.15 | -4.09 | 13.74 | 11.96 | 10.56 | 8.98 | 7.79 |
| | (0.45) | (0.13) | (0.33) | (0.40) | (0.42) | (0.43) | (0.44) |
| | **Panel B: Instrument Calls with Treatment Status** | **Panel B: Instrument Calls with Treatment Status** | **Panel B: Instrument Calls with Treatment Status** | **Panel B: Instrument Calls with Treatment Status** | **Panel B: Instrument Calls with Treatment Status** | **Panel B: Instrument Calls with Treatment Status** | **Panel B: Instrument Calls with Treatment Status** |
| Called E2E | 11.74 | -7.81 | 26.20 | 22.82 | 20.15 | 17.14 | 14.86 |
| | (0.84) | (0.24) | (0.62) | (0.75) | (0.80) | (0.82) | (0.83) |
| Control Group Mean | 48.57 | 21.00 | 13.64 | 25.89 | 32.59 | 37.77 | 42.15 |
| Complier Mean | 63.28 | 14.84 | 33.26 | 45.13 | 50.70 | 54.83 | 58.20 |
| Observations | 64,798 | 64,798 | 64,798 | 64,798 | 64,798 | 64,798 | 64,798 |
Notes: The table reports the estimated effect of the intervention on application approval rates and timeliness. Outcomes include an indicator for being approved by the 30-day deadline (column 1), number of days before an application received a determination (column 2), and indicators for application approvals within the given number of days since submission in 5-day increments (columns 3-7). Panel A presents intent-to-treat estimates. Panel B presents estimates derived from a two-stage least-squares specification in which an indicator for calling the E2E line is instrumented for by an indicator for treatment status. Coefficient estimates are reported in days for column 2 and in percentage points (0-100) for all other columns. Parentheses contain heteroskedasticity robust standard errors.
**Table A.5. Effect of Intervention on Long-Term SNAP Participation (No Controls)**
| | Approved by Day | Approved by Day | Approved by Day | Approved by Day |
| --- | --- | --- | --- | --- |
| | Day 60 | Day 90 | Day 120 | Day 150 |
| | (1) | (2) | (3) | (4) |
| | **Panel A: Intent to Treat** | **Panel A: Intent to Treat** | **Panel A: Intent to Treat** | **Panel A: Intent to Treat** |
| Treatment | 2.82 | 2.41 | 2.20 | 2.12 |
| | (0.45) | (0.44) | (0.44) | (0.44) |
| | **Panel B: Instrument Calls with Treatment Status** | **Panel B: Instrument Calls with Treatment Status** | **Panel B: Instrument Calls with Treatment Status** | **Panel B: Instrument Calls with Treatment Status** |
| Called E2E | 5.38 | 4.60 | 4.20 | 4.04 |
| | (0.85) | (0.84) | (0.84) | (0.84) |
| Control Group Mean | 58.12 | 59.84 | 60.62 | 61.25 |
| Complier Mean | 69.85 | 71.07 | 71.60 | 72.02 |
| Observations | 64,798 | 64,798 | 64,798 | 64,798 |
Notes: The table reports the estimated effect of the intervention on longer-term SNAP participation. Outcomes: indicators for being approved by days 60, 90, 120, and 150 (columns 1-4, respectively). Panel A presents intent-to-treat estimates. Panel B presents estimates derived from a two-stage least-squares specification in which an indicator for calling the E2E line is instrumented for by an indicator for treatment status. Coefficient estimates are reported in percentage points (0-100). Parentheses contain heteroskedasticity robust standard errors.
**Table A.6. Effect of Intervention on Reapplication Approval Rate by Initial Experimental Group**
| | \(1\) | \(2\) | \(3\) |
| --- | --- | --- | --- |
| Initial Application Treatment: | All | Control | Treatment |
| Reapplication Treated | 5.19 | 9.67 | 3.61 |
| | (4.48) | (9.00) | (5.43) |
| Outcome Mean | 70.62 | 73.22 | 69.52 |
| Observations | 616 | 183 | 433 |
Notes: The table reports the estimated effect of receiving the intervention in a repeat application. The outcome is indicator for whether the repeat application is approved for SNAP. We restrict the sample to cases with a single reapplication within 90 days of their initial application. Column 1 presents the results for all reapplications, regardless of initial treatment status. Column 2 restricts the sample to reapplicants whose initial application was assigned to the control group. Column 3 restricts the sample to reapplicants whose initial application was assigned to the treatment group. All specifications include week, day-of-week, and SNAP office fixed effects as well as household characteristics including household size, age, sex, elderly or disabled status, language, income, cash on hand, SSI receipt, stable housing, rent, expedited benefit qualification, and estimated eligibility. Coefficient estimates are reported in percentage points (0-100). Parentheses contain heteroskedasticity robust standard errors.
**Table A.7. Effect of E2E Roll-out on SNAP Approval Rates**
| | \(1\) | \(2\) |
| --- | --- | --- |
| | Control | Treated |
| E2E Rolled Out | -1.648 | 5.13 |
| | (2.029) | (1.655) |
| Untreated Office Mean | 50.93 | 50.93 |
| Observations | 132062 | 157979 |
Notes: The table reports the estimated effect the staggered roll-out of E2E by SNAP office on SNAP approval rates using the (Callaway and SantAnna 2021) difference-in-differences estimator. Data include all GetCalFresh applications between August 1, 2020 and May 15, 2021. Column 1 estimates the effect on control group members by dropping treated applications from the analysis, while column 2 estimates the effect on treatment group members by dropping controls.
**Table A.8. Treatment Effects by Office: Long-term SNAP Participation**
| | \(1\) | \(2\) | \(3\) | \(4\) | \(5\) |
| --- | --- | --- | --- | --- | --- |
| | Estimate | Standard Error | $p$ value | Control Mean | $N$ |
| El Monte | 3.66 | 1.53 | 0.02 | 57.4 | 5075 |
| Exposition Park | 1.08 | 3.20 | 0.73 | 56.6 | 1179 |
| Glendale | 1.82 | 1.48 | 0.22 | 61.4 | 5109 |
| Lancaster | -0.87 | 2.26 | 0.70 | 69.8 | 2057 |
| Metro East | -0.32 | 2.09 | 0.88 | 61.1 | 2710 |
| Metro Special | 0.98 | 1.14 | 0.39 | 64.7 | 8315 |
| Norwalk | 2.50 | 1.86 | 0.18 | 61.4 | 3457 |
| Pomona | 4.38 | 1.41 | 0.00 | 58.4 | 5894 |
| Rancho Park | 2.39 | 1.56 | 0.13 | 64.7 | 4498 |
| South Family | 5.56 | 1.36 | 0.00 | 56.9 | 6457 |
| Southwest Special | -0.08 | 1.28 | 0.95 | 63.3 | 7074 |
| West Valley | 3.29 | 2.62 | 0.21 | 56.9 | 1770 |
| Wilshire Special | 2.34 | 3.19 | 0.46 | 64.2 | 1130 |
Notes: The table reports the estimated effect of the intervention on long-term SNAP participation by SNAP office (column 1). Column 2 contains heteroskedasticity robust standard errors and column 3 contains the associated p-value. Column 4 presents the control group mean. The outcome variable is an indicator for every receiving SNAP within 150 days of application submission. All regressions include week, day-of-week, and SNAP office fixed effects as well as household characteristics including household size, age and sex of the application submitter, whether the household contains an elderly or disabled member, case language, income in the last 30 days (indicator and dollar amount), any cash on hand (indicator and dollar amount), an indicator for non-job income, whether the household receives SSI, an indicator for being in stable housing, monthly rent, expedited benefit qualification, and estimated eligibility. Coefficient estimates are reported in percentage points (0-100).
## References
Bergman, Peter, Jeffrey T Denning, and Dayanand Manoli. 2019. “Is Information Enough? The Effect of Information about Education Tax Benefits on Student Outcomes.” *Journal of Policy Analysis and Management* 38 (3): 706–31.
Bettinger, Eric P, Bridget Terry Long, Philip Oreopoulos, and Lisa Sanbonmatsu. 2012. “The Role of Application Assistance and Information in College Decisions: Results from the h&r Block FAFSA Experiment.” *The Quarterly Journal of Economics* 127 (3): 1205–42.
Bhargava, Saurabh, and Dayanand Manoli. 2015. “Psychological Frictions and the Incomplete Take-up of Social Benefits: Evidence from an IRS Field Experiment.” *American Economic Review* 105 (11): 3489–529.
Callaway, Brantly, and Pedro HC SantAnna. 2021. “Difference-in-Differences with Multiple Time Periods.” *Journal of Econometrics* 225 (2): 200–230.
Currie, Janet. 2006. “The Take-up of Social Benefits.” In *Poverty, the Distribution of Income, and Public Policy*, edited by Alan Auerbach, David Card, and John Quigley. New York: Russell Sage.
Deshpande, Manasi, and Yue Li. 2019. “Who Is Screened Out? Application Costs and the Targeting of Disability Programs.” *American Economic Journal: Economic Policy* 11 (4): 213–48.
Dynarski, Susan, CJ Libassi, Katherine Michelmore, and Stephanie Owen. 2021. “Closing the Gap: The Effect of Reducing Complexity and Uncertainty in College Pricing on the Choices of Low-Income Students.” *American Economic Review* 111 (6): 1721–56. .
Emanuel, Natalia, and Helen Ho. 2023. “Tripping Through Hoops: The Effect of Violating Compulsory Government Procedures.” *American Economic Journal: Economic Policy*.
Finkelstein, Amy, and Matthew J Notowidigdo. 2019. “Take-up and Targeting: Experimental Evidence from SNAP.” *The Quarterly Journal of Economics* 134 (3): 1505–56.
Fishbane, Alissa, Aurelie Ouss, and Anuj K Shah. 2020. “Behavioral Nudges Reduce Failure to Appear for Court.” *Science* 370 (6517): eabb6591.
Gianella, Eric, Tatiana Homonoff, Gwen Rino, and Jason Somerville. 2022. *Removing Barriers to Program Enrollment: Experimental Evidence from SNAP.*
Gianella, Eric, Tatiana Homonoff, Gwen Rino, and Jason Somerville. 2024. “Data and Code for: Administrative Burden and Procedural Denials: Experimental Evidence from SNAP.” *American Economic Association \[Publisher\]*.
Herbst, Daniel. 2022. “The Impact of Income-Driven Repayment on Student Borrower Outcomes.” *American Economic Journal: Economic Policy*.
Herd, Pamela, and Donald P Moynihan. 2019. *Administrative Burden: Policymaking by Other Means*. Russell Sage Foundation.
Homonoff, Tatiana, and Jason Somerville. 2021. “Program Recertification Costs: Evidence from SNAP.” *American Economic Journal: Economic Policy* 13 (4): 271–98.
Kopczuk, Wojciech, and Cristian Pop-Eleches. 2007. “Electronic Filing, Tax Preparers and Participation in the Earned Income Tax Credit.” *Journal of Public Economics* 91 (7-8): 1351–67.
Linos, Elizabeth, Allen Prohofsky, Aparna Ramesh, Jesse Rothstein, and Matthew Unrath. 2022. “Can Nudges Increase Take-up of the EITC? Evidence from Multiple Field Experiments.” *American Economic Journal: Economic Policy* 14 (4): 432–52.
List, John A. 2022. *The Voltage Effect: How to Make Good Ideas Great and Great Ideas Scale*. Currency.
Lopoo, Leonard M, Colleen Heflin, Joseph Boskovski, et al. 2020. “Testing Behavioral Interventions Designed to Improve on-Time SNAP Recertification.” *Journal of Behavioral Public Administration* 3 (2).
Marbach, Moritz, and Dominik Hangartner. 2020. “Profiling Compliers and Noncompliers for Instrumental-Variable Analysis.” *Political Analysis* 28 (3): 435–44.
Mills, Gregory, Tracy Vericker, Heather Koball, Kye Lippold, Laura Wheaton, and Sam Elkin. 2014. *Understanding the Rates, Causes, and Costs of Churning in the Supplemental Nutrition Assistance Program*. United States Department of Agriculture, Food; Nutrition Service, Office of Policy Support.
Mueller, Holger, and Constantine Yannelis. 2022. “Increasing Enrollment in Income-Driven Student Loan Repayment Plans: Evidence from the Navient Field Experiment.” *The Journal of Finance* 77 (1): 367–402.
Nichols, Albert L, and Richard J Zeckhauser. 1982. “Targeting Transfers Through Restrictions on Recipients.” *The American Economic Review* 72 (2): 372–77.
Rossin-Slater, Maya. 2013. “WIC in Your Neighborhood: New Evidence on the Impacts of Geographic Access to Clinics.” *Journal of Public Economics* 102: 51–69.
Rowe, Gretchen, Andrew Gothro, Elizabeth Brown, Lisa Dragoset, and Megan Eguchi. 2015. *Assessment of the Contributions of an Interview to SNAP Eligibility and Benefit Determinations*. United States Department of Agriculture, Food; Nutrition Services.
Wu, Derek, and Bruce Meyer. 2022. “Certification and Recertification in Welfare Programs: What Happens When Automation Goes Wrong?” *Mimeo*.
[^1]: Giannella: Code for America. Homonoff: Robert F. Wagner School of Public Service, New York University and NBER (email: tatiana.homonoff@nyu.edu). Rino: Code for America. Somerville: Federal Reserve Bank of New York. For helpful comments and suggestions, we thank Jacob Goldin, Daphne Skandalis, and seminar participants at George Washington University, University of Chicago-Booth, Central Bank of Ireland, University of Maryland, University of Virginia, Brown University, DePaul University, the Wharton School of the University of Pennsylvania, Manhattan College, University of Chicago-Harris, and NBER-TAPES, NTA, APPAM, and AEA conferences. Felix Aidala provided excellent research assistance. This research would not have been possible without support from the LA DPSS team, from eligibility workers and supervisors to those who led and coordinated the changes required for the pilot, including Michelle Sepulveda, Elizabeth Morris, Maria Montoya and Rosa Serna, La Shonda Diggs, Nicole Williams, Diego Echeverri, and Maria Sanchez. The findings reported herein were performed with the permission of CDSS. The opinions and conclusions expressed herein are solely those of the authors do not necessarily reflect the views of the Federal Reserve Bank of New York or the Federal Reserve System and should not be considered as representing the policy of the collaborating agency or of any agency of the California government. This RCT was registered in the American Economic Association Registry for randomized control trials under trial number AEARCTR-0009728 (Gianella et al. 2024). The data and code are deposited with the AEA Data and Code Repository at ICPSR (Gianella et al. 2022).
[^2]: Other safety net programs requiring intake interviews include the Special Supplemental Nutrition Program for Women, Infants and Children (WIC), Temporary Assistance for Needy Families (TANF), and Disability Insurance (DI).
[^3]: Informational nudges have been shown to be effective in other domains as well, such as reducing failure to appear in court (Fishbane et al. 2020; Emanuel and Ho 2023).
[^4]: Gross income includes income from any source including all earned income and all unearned income. Net income is calculated as gross income minus allowances for certain expenses including housing, utilities, childcare, and medical care.
[^5]: Households qualify for expedited, or “emergency,” benefits if they have less than \$150 in gross monthly income and \$100 or less in “liquid resources,” such as cash or checking accounts.
[^6]: All face-to-face interviews were temporarily suspended in March 2020 and a waiver of the requirement to conduct face-to-face interviews extended through our full study period. Several other SNAP operations waivers were introduced in response to the pandemic, including extended certification periods and the temporary elimination of work requirements. Most importantly, California adopted a waiver that removed the interview requirement in October 2020; however, in practice, Los Angeles used these waivers very infrequently.
[^7]: Applicants may request assistance in any of the 10 supported languages. Applicants are either connected to a caseworker who speaks that language or an interpreter is added to the call if a caseworker is not available.
[^8]: The appointment letters sent by the county include the scheduled date and time for the interview; however, the communications from GetCalFresh only include a general reminder about the interview requirement since the GetCalFresh administrators do not have access to information on the appointment time.
[^9]: We do not have data on how the ease of rescheduling in Los Angeles compares to that in other counties or states; however, prior research suggests that even in particularly well-staffed offices, relatively few individuals who miss their caseworker interview reschedule their appointment (Homonoff and Somerville 2021).
[^10]: In practice, this service was not widely publicized and offered only to individuals who happened to call a SNAP office to inquire about applying when an E2E staff member was available.
[^11]: As of April 2020, fifteen states had a certification waiver that allowed them to conduct unscheduled interviews.
[^12]: Communications were sent on the same day that the application was submitted for those submitted Monday through to Thursday, or on the following Monday for those submitted on a Friday. This approach ensured that the E2E line was open when the applicant first received the contact information.
[^13]: More than half of these repeat applications occurred within five days of the original application and roughly one third were submitted on the same day.
[^14]: As shown in Appendix Figure [A.1](#fig:online_method), roughly half of all applications to Los Angeles County are submitted through GetCalFresh. While we cannot estimate the fraction of *re*applications by submission method or, more specifically, the fraction of GetCalFresh applicants who reapply via GetCalFresh, we believe that it is very likely that applicants who originally applied through GetCalFresh choose to reapply through the same method.
[^15]: We choose control group members who did not call E2E (i.e. 99.5 percent of control-group applications) as this is the policy-relevant comparison group that motivated the intervention (see also (Emanuel and Ho 2023) who provide a similar rationale when assessing an intervention designed to reduce court violations). Furthermore, applicants that always call E2E regardless of treatment are a small, highly selected group given that we implemented our intervention to ensure that share of always takers is close to zero by design; indeed, we estimate that only 0.5% of our sample are always takers.
[^16]: Appendix Table [A.3](#tab:takeup_char) presents a complementary analysis which compares the share of applicants in the treatment group who called the E2E line across a number of demographic and case characteristics with similar conclusions.
[^17]: Appendix Table [A.4](#tab:main_nocontrols) presents a version of Table [5](#tab:main) that excludes all controls. Results are qualitatively similar for all outcomes considered.
[^18]: For this analysis, we consider the small fraction of cases whose status is pending as of the application deadline as determined on day 30, though this decision does not meaningfully change our results.
[^19]: In Appendix Table [A.5](#tab:long_term_participation_nocontrols), we presents estimates without controls and find similar results.
[^20]: Specifically, we consider all reapplications among households whose initial applications were denied but reapplied before the end of our study period and within 90 days of their initial submission date. We also restrict this sample to exclude households with multiple reapplications during this period (roughly a quarter of all reapplications).
[^21]: That is, we can rule out a negative effect on the approval rate of the control group larger than three times the size of the lower bound estimate of the positive effect of the intervention on the treated group.
[^22]: For example, (Wu and Meyer 2022) suggest that long wait times at call centers may have undermined the success of welfare application automation in Indiana.
[^23]: It is worth noting that throughout the intervention, 75 percent of applicants in treated offices had access to E2E and that all offices were treated by April 2021 (Appendix Figure [A.3](#fig:participating_offices)). Therefore, by the end of our intervention, the program was already very close to being “at scale”.
[^24]: It is worth noting that expedited cases receive scheduled interviews within three days of interview submission, while non-expedited cases receive scheduled interview up to ten days after submission. Therefore, we cannot rule out that the differential effect by expedited status may be driven by these administrative differences if our intervention is particularly helpful for cases assigned to early interviews.
[^25]: Column 8 includes all of the above interactions simultaneously to account for any collinearities. Results are qualitatively similar.