Can chocolate cure blindness? Investigating the effect of preference strength and incentives on the incidence of Choice Blindness
Jason Somerville and Féidhlim McGowan
Contents
Abstract
Choice Blindness occurs when individuals fail to notice a mismatch between their stated preference and the outcome of their choice. While it is prevalent in areas of considerable economic importance, such as consumer choice for non-durables, pension decisions, and risk preferences, little is known about the underlying cause of this apparent cognitive blind spot. We examine whether the CB effect is robust when the stimuli is a product for which participants display a strong overall preference, specifically children’s preference for chocolate. First, we demonstrate that Choice Blindness for female faces is a general cognitive blind spot that is robust for a large sample of children aged 8–12. Second, we show that when the stimuli are chocolates, there is a substantial reduction in the incidence of Choice Blindness; only 10–20% of participants failed to notice the choice manipulation. Subjects who reported a greater affinity for chocolate were more likely to detect mismatches. However, we found that the strength of the relative preference ordering within the set of chocolates did not affect the incidence of Choice Blindness. Moreover, incentive compatibility did not increase detection rates; participants were just as likely to notice a mismatch regardless of whether or they actually received the chocolate they chose. We propose that this phenomenon can be viewed as an error resulting from the early stages preference development.
1. Introduction
Choice Blindness (henceforth CB) refers to a situation in which individuals fail to notice a mismatch between their intentioned choice and the option they receive. In the standard experimental paradigm, a sleight-of-hand technique is used to manipulate the relationship between intention and outcome. In a typical set up, participants are presented with a binary choice between two options, and asked to state the option they prefer. Once stated they are given their choice and asked to explain why they chose as they did. However, unbeknownst to the participant, on some trials, a sleight-of-hand manipulation is employed and they receive the alternative forgone instead. By examining the number of detected manipulations and the verbal reports by participants, this paradigm has the potential to shed light of the relationship between preference strength and choice.
While initially demonstrated for pictures of female faces (Johansson et al., 2005), CB is prevalent in areas of considerable economic importance, such as consumer choice for non-durables (Hall et al., 2010), pension decisions (McLaughlin and Somerville, 2013), and risk preferences (Johansson, Hall and Chater, 2012). It has also been demonstrated in studies of political preferences (Hall et al., 2013), morality (Hall, Johansson and Strandberg, 2012), haptic choices (Steenfeldt-Kristensen and Thronton, 2013), and witness testimony for faces and voices (Sagana, Sauerland and Merckelbach, 2013; Sauerland, Sagana and Otgaar, 2013). These studies have repeatedly found that only 20–35% of participants detect the manipulation of their stated preferences (Johansson, Hall and Chater, 2012).
Despite the seemingly pervasive nature of the CB phenomenon, the mechanisms underlying its effect are yet to be identified. A recent study by Sauerland et al. (2014) investigated the potential significance of self-relevance as a mediator of the effect. In a sample of children and adolescents they found a strong CB effect for a variety of durable goods (such as chairs, t-shirts and plastic toys) and some foods. However, the prevalence of CB was not mediated by the self-relevance of the good in question (e.g. chairs and desks versus chairs and desks for your classroom). Moreover, neither memory (McLaughlin and Somerville, 2013; Sagana, Sauerland and Merckelbach, 2014a) nor lack of attention to the task (Johansson et al., 2014) explain such low detection rates.
At face value, the observation that people appear to have static inconsistencies in their preferences raises concerns for models of consumer choice. It implies that people may not have stable ordered preferences, and the magnitude of the effect goes significantly beyond what would be expected by merely positing random errors in valuation (Loomes and Sugden, 1995; Woodford, 2014). Indeed, it has been argued that CB is something “for economists to ponder in their modelling” (Hall et al., 2010, p. 60). However, two important factors must be addressed before that becomes necessary.
The first criticism of the literature to date is that the stimuli most frequently used, fall significantly short of the self-relevance afforded to many of the goods consumers encounter on a daily basis. Consumers typically make choices over goods for which they have encountered previously, and have established preference orders. Many models of consumer choice have long posited that decision making is prone to error due to information-processing constraints (Cason and Plott, 2014). In particular, ill-defined preferences for unfamiliar products may be particularly subject to mistakes (see Bettman, Luce and Payne, 1998 for a review). Whether CB is simply a manifestation of the stochastic error inherent in preference formation or a more general cognitive limitation, is the pertinent economic question.
The subjective nature of preferences, and the difficulties associated with labelling these constructs “strong” or “weak”, makes direct manipulation extremely challenging. However, without some attempt to explicitly control for both the overall strength of preference for the product and the strength of preference between varieties, the generalisability of these results to the vast majority of consumer choice remains limited.
A second, but related, issue is that these experiments present choices that do not resemble the majority of real-life economic decisions undertaken daily; incentive-compatible conditions have rarely been adhered to in CB experiments.
The motivation for this study was therefore to examine whether CB is robust in circumstances in which the choice involves a product that subjects have a strong overall affinity for and are highly incentivised. This study overcame the common difficulty of appropriately incentivising participants (Read, 2005), by capitalising on the well-established behavioural tendency of children to exhibit a strong preference for chocolate. A robustness check was performed to ensure the assumption of children liking chocolate was warranted. By examining the robustness of CB when subjects exhibit a strong overall preference for the product (i.e. for chocolates), incentive-compatible conditions were developed to test for the effect of incentivisation.
First, to establish a baseline control condition, the standard CB paradigm using pictures of female faces was replicated using children aged 8–12 as subjects. While some age effects are reported, the CB effect persists for children in this age cohort, suggesting that the mechanism underlying the effect is established at an early stage of cognitive development. Second, when children make choices over pairs of chocolates, the CB phenomenon is substantially diminished; manipulations of choice are detected approximately 85% of the time when the stimuli are familiar chocolates. Experimental controls and robustness checks ensured that no other aspect of the experimental design was responsible for generating the results obtained.
Section 2 of this paper reviews the relevant literature and outlines the research hypotheses. Section 3 describes the experimental design. Section 4 details the results of the experiment. Section 5 discusses the findings and conclusions.
2. Literature review
Stretching back to Simon’s work on bounded rationality (1955), there has been a long tradition of incorporating information-processing constraints into microeconomic models of decision making. In contrast to the revealed preference approach, which does not consider potential limits on one’s cognitive ability to integrate multiple sources of information, these alternative approaches allow one’s preferences to be constructed as a response to the task environment or complexity. Gregory, Lichenstein and Slovic, (1993) summarise this dichotomy succinctly: constructive preference formation is similar to architecture – building some coherent set of values when required to do so; revealed preference is more like archaeology – simply unearthing values that are already there.
Bettman, Luce and Payne’s (1998) comprehensive review of constructive consumer choice processes provides a conceptual framework for analysing the possible mechanisms underlying CB. First, the authors summarise a large experimental literature suggesting that preferences are constructed in response to the task at hand. In particular, they emphasise the importance of “choice dynamics”, which, simply put, is how the focus of attention changes over a choice episode. At the surface level, the errors made in CB tasks seem to offer insight into this dynamic process, namely a failure to detect a mismatch between choice and outcome may reflect the stochastic process of constructing preferences. A priori, this is the aspect of CB that may prove useful to future models of preference formation.
The idea that an individual’s preferences evolve over time formed the basis of Plott’s (1996) “discovered preferences” hypothesis, which sought to reconcile the vast literature on preference reversals with neoclassical consumer theory. He suggested that there are three stages of experience and practice through which rational choices evolve. In the first stage, when experience is absent, “behaviour could appear to have a substantial random component because inconsistencies among choices may be present” (p. 227). The presence of a CB effect is theoretically compatible with this infancy stage of preference development. In the second stage of preference development, the individual gains experience through feedback, facing repeated choices and motivation when incentives are appropriate. At the end of this stage consistent and stable preferences become established.
There is ample literature on preference reversals to lend support to the discovered preferences hypothesis. Inconsistent choices between two gambles of similar expected value have been extensively documented (Slovic and Loewenstein, 1971; Grether and Plott, 1979; Tversky, Slovic and Kahneman, 1990). Yet, a combination of incentives and repetition eliminates instances of reversals as participants gain experience at the task (Cox and Grether, 1996; List and Shrogen, 1999). The abolition of the reversal phenomenon in certain domains has a relevance to CB studies: if participants lack market experience, evidence of inconsistencies, i.e. not noticing the manipulation, may be a simple manifestation of the stochastic element in stage one of Plott’s (1996) preference discovery hypothesis.
One recent theoretical attempt to incorporate the process of preference learning into the neoclassical optimising framework of consumer choice (Jacobson, Delaney and Moenig, 2014), predicts that preferences for non-stochastic choice items are learned quickly and become stable. Therefore, the more pertinent issue from the standpoint of microeconomic theory is whether CB persists in a domain in which individuals have had ample time to establish a preference order.
The relationship between mistakes and preferences, and what can and cannot be inferred from such observations, is still a source of controversy. In attempt to clarify this issue, Cason and Plott (2014) endowed participants with a card that could be redeemed with certainty for $2 and instructed them to write down a minimum selling price on the card. Each then turned over the card and removed a tab to reveal a random posted price for the card. If the posted price was above the participant’s offer price the participant was paid the posted price and if not the participant was paid $2 for the card. The optimal strategy, from the perspective of an expected utility maximiser, is to indicate an offer price of $2, following a similar logic as in second price auctions. Interestingly, subjects who made the optimal decision in the first round displayed stable preferences when the game was repeated, whereas many of those who made suboptimal decisions converged towards the optimal in the second round. Although the authors explicitly take framing as the fulcrum around which to discuss these results, the systematic mistakes displayed in their experimental demonstration strike the same chord with those seen in CB tasks, albeit at a different pitch.
This paper tests several hypotheses of relevance to the literature with an eye to the potential generalisability of CB to consumer choice. First, while CB for female faces has been replicated in various studies (Johansson et al., 2005; Johansson et al., 2006) it is unknown if this effect holds for younger participants. Replicating the CB effect for female faces for children ages 8–12 is essential to serve as a control condition and test the generalisability of these findings to children aged 8–12. Regardless of whether detection rates are influenced by age, this provides a baseline against which to contextualise detection rates when participants choose between chocolates. More formally, we state our first hypothesis as;
H1: The standard CB effect for female faces, as reported in Johansson et al. (2005), is robust when the subjects are children aged 8–12.
Second, the CB literature to date has concentrated almost exclusively on domains in which people are considered extremely adept at discriminating perceptually, such as face recognition, and areas with particular relevance for policy, such as witness testimony (Sagana, Sauerland and Merckelbach, 2013). However, whether the CB effect generalises to the majority of consumer decisions is unclear. One application to consumer choice is provided by Hall et al. (2010), who had shoppers choose between different types of teas and jams, while covertly manipulating the outcomes of their supposed choices. The participants who approached the sample stand were given their “choice” to keep, thus partly aligning incentives. Despite the naturalistic decision context and the introduction of incentives, only 35% of mismatches were detected. However, two limitations hamper extending these findings to consumer choice more generally. First is it unclear whether or not participants held strong, well-established preferences for teas and jams and were familiar with the varieties on offer. The very fact that participants approached a sample stand would suggest that they did not have a well-defined preference ranking for these goods to begin with. Moreover, while participants got to keep the item they chose, if they held only a mild preference jam overall, the incentive is a relatively poor one. Therefore, the second hypothesis of this paper is to examine whether the CB effect is robust when the stimuli is a product for which participants display a strong overall preference.
H2: With chocolates as stimuli, detection rates are higher than for female faces.
To disentangle what is a strong liking for chocolate from a mere familiarity effect, we propose a ‘love of chocolate’ variable based on a simple 5-point Likert scale. We can test whether this has a direct effect on detection rates, and whether any other effects are robust to its inclusion.
H3: Participants who state a greater affinity for chocolate are less likely to exhibit CB.
It is important to distinguish a preference for chocolate overall from the strength of preference between chocolates. The distinction is crucial as it is possible to hold a weak preference for chocolate overall, but a strong preference between chocolates. For example, imagine a hypothetical participant with lexicographic preferences over the 8 choices in the “chocolate set”. This participant could dislike every chocolate in the set except for option A, thus demonstrating a low preference for chocolate overall but an extremely strong preference for any pair involving option A.
To test this, as a proxy for preference strength between chocolates, we include a pre and post ranking survey of the 8 chocolates used in the study. We speculate that weakly-held preferences between chocolates should produce more intransitivities and less consistent preference orderings than those who hold strong between chocolate preferences.
H4: More consistent pre- and post-experiment stated preferences are positively related to detection rates.
A long running debate in experimental economics concerns the significance of ensuring incentive-compatible conditions. Since at least Wallis and Friedman (1942), concerns have been voiced regarding the generalisability of experimental results to ‘real-world’ economic choice. More recently it has been argued that this is often best achieved without monetary incentives (Read, 2005). The issue is therefore whether incentive compatible conditions (in terms of consumption, not monetary amounts), will increase detection rates.
H5: When subjects get to keep their stated preference, the number of manipulations detected increases.
Finally, it is important to note that the use of children as subjects brings some notable benefits, but also some obvious limitations. In particular, cognitive limitations may make children more susceptible to choice manipulations. This would induce a downward bias in detection rates, which for the purpose of the current investigation would imply that any effect is in fact a conservative estimate. Using chocolates as the task stimulus is not an unfamiliar approach in consumer choice experiments; Chernev (2003), for example, used chocolates to show individuals make more consistent choice when strong prior preferences exist. The specific experimental technique of incentivising children using chocolates also has a precedent, as the diversification bias was investigated using Halloween trick-or-treaters aged 3–14 (Read and Loewenstein, 1995). Their findings were replicated in a diversification bias study that looked at actual investors’ portfolios (Benartzi and Thaler, 2001). Moreover, a recent CB study used both children and adolescents as participants, and found a relatively large CB effect for goods such as chairs, t-shirts and plastic toys (Sauerland et al., 2014).
3. Experimental approach
A total of 381 participants (154 female) were recruited from four primary schools in County Dublin, Ireland: Terenure College Junior School (n = 52); Scoil Áine, Lucan (n = 47); St. Brigid’s, Castleknock (n = 138); and St. Molaga’s, Balbriggan (n = 144). The participants were aged 8–12 (M = 10.3, SD = 0.98). Consent forms were signed by a parent or legal guardian before the experiment, and again on the day of the experiment by the participants themselves.
The main experimental materials were two sets of 8.5×7 cm red cards, one featuring images of female faces and the other images of chocolates. The pictures of dissimilar female faces were the ones used in Johansson et al. (2005) and are presented in Appendix A. The dissimilar faces, as defined by Johansson et al. (2005), were chosen to maximise the probability of detection and to ensure a conservative control condition. The pictures of chocolates, and the actual chocolates used were the ones contained in the “Celebrations” chocolate collection made by Mars, Incorporated (see Appendix A). These chocolates were selected due to their popularity so as to maximise the probability that participants were familiar with the brands and had an established preference ordering. A second set of cards with identical pictures affixed to black cardboard was used to enable the sleight-of-hand ploy. A matching black table cover facilitated switching on manipulated trials.
There were three experimental conditions. In the first, the stimuli were the pictures of female faces. In the second, the stimuli were pictures of the chocolates described above. In the third, the stimuli were the same pictures of chocolates, but with the actual chocolates concealed behind them. The order in which these trials were presented was pseudo-randomised by the experimenter by drawing a number from one to six from a hat.
Two experimenters – situated in adjacent rooms – carried out the experiment. The first experimenter read the participant information and consent sheet to the participant, explaining in simple terms what the experiment entailed. This experimenter also noted the participant’s demographic information and asked the participant to rate how much they liked chocolate generally, on a scale of one to five. The experimenter then presented the participant with a page containing images of the eight brands of chocolate and asked the participant to indicate which chocolate was his, or her favourite. This chocolate was marked with a ‘1’. This process continued until the chocolates had been ranked from one to eight. The participant was then conducted to a separate room for the main task.
The second experimenter then carried out the main trials. The participant was told that the experimenter was interested in how people make choices and explained again exactly what the task entailed. Once the participant agreed to take part, the experiment began. Before each experimental block (called a “game”), the experimenter told the participant that either they would get to keep the option they chose (in the actual chocolates condition), or that they would not get to keep their chosen option (in the two pictures conditions). On each trial, the participant was presented with two photo cards of either female faces or chocolates and asked to choose which one they preferred. Each photo was randomly drawn from the eight potential options. The participant was then given the picture (or the chocolate) they chose and asked to explain why they chose as they did.
All participants completed all three conditions described above. Each game consisted of three trials. The first and third trials of each condition followed the procedure above, with no manipulation of choices. However on the second trial, a sleight-of-hand ploy was used to covertly exchange one stimulus for the other and manipulate the participant’s choice. 1 Thus, on this trial the participant was presented with the opposite of whatever stimulus they had chosen. If the manipulation was detected during this phase of the experiment, the experimenter gave the participant his or her intended choice and passed off the switch as an honest mistake so as to minimise suspicion regarding the true nature of the experiment. All the trials were recorded and transcribed subsequently.
When all three conditions were completed, the participant returned to the first experimenter, where he or she was asked a series of questions about the task (see Appendix C). In particular, the first experimenter asked increasingly specific questions aimed at determining whether or not the subject had noticed a mismatch but not reported it. This allowed the participants to indicate retrospectively if they had noticed any of the manipulation trials. If at any stage a participant reported noticing a mismatch, retrospective detection was recorded. This step was necessary to control for the situation whereby children may have noticed the experimenter giving them the incorrect option but failed to mention it because they were too shy or polite. In this way the first experimenter acted as a confidant of sorts. Once all the questions were answered or a mismatch was reported, the participant was debriefed as to the true nature of task. At the end of the experiment the participant was asked to rate the chocolates once again using the same procedure as before. The degree of consistency between the pre and post experimental rankings of the chocolates was taken to be a proxy measure of the relative strength of preference between chocolates. 2 Participants were asked (at the request of the schools) to not consume the chocolate they had just been given until the recess period. Finally, the participant was asked not to reveal any details of the task to any classmates, especially during the recess period.
4. Results
The experiment produced 381 sets of data, one for each participant. Each set contained a total of nine trials, three for each condition. Data for two participants were removed due to one data recording error and one participant becoming aware of the nature of the task prior to participation.
The outcome variable of interest was a binary variable indicating whether or not a subject detected a mismatch between their choice and the option they received. Following the established CB paradigm, three different detection classifications were used. “Concurrent detection” refers to instances when a subject reported a discrepancy immediately after the manipulation occurred. “Retrospective detection” was recorded when, having not reported anything at the time of the manipulation, subjects reported noticing a mismatch during the post-experiment questionnaire. Finally, “Overall detection” refers to any instances where either concurrent or retrospective detection was reported.
To test whether CB generalised to children aged 8–12 (H1), we can examine the descriptive data for the control condition, which used pictures of female faces as stimuli, as in Johansson et al. (2005). Concurrent detection rates were 20.6% and when retrospective detections were included, overall detection more than doubled to 43.0%, which is similar to the detection rates reported by Johansson et al. (2005). While Johansson et al. (2005) explicitly paired faces, in the current study they were drawn at random. However, given the size of the sample, it is possible to test for whether there is a difference in detection rates when these specific pairs were randomly selected. For concurrent and overall detection categories, the difference between randomly selected pairs and the pairings used in Johansson et al. (2005) is less than a percentage point and not statistically significant using a simple t-test (p > 0.1). Taken together, these results suggest that CB for female faces is present in children ages 8–12.
The overall effect of using chocolates as stimuli is readily assessed by inspection of the descriptive data (H2). Fig. 1 illustrates mean detection rates across the three experimental conditions (pictures of female faces, pictures of chocolates, and actual chocolates) for both concurrent and overall detection classifications. For the two treatment conditions, concurrent detection rates increased almost threefold to 64.3% for pictures of chocolate, and 58.7% for actual chocolates. For pictures of chocolates the total detection rate increased to 80.4%, while for actual chocolates it rose to 87.8%.
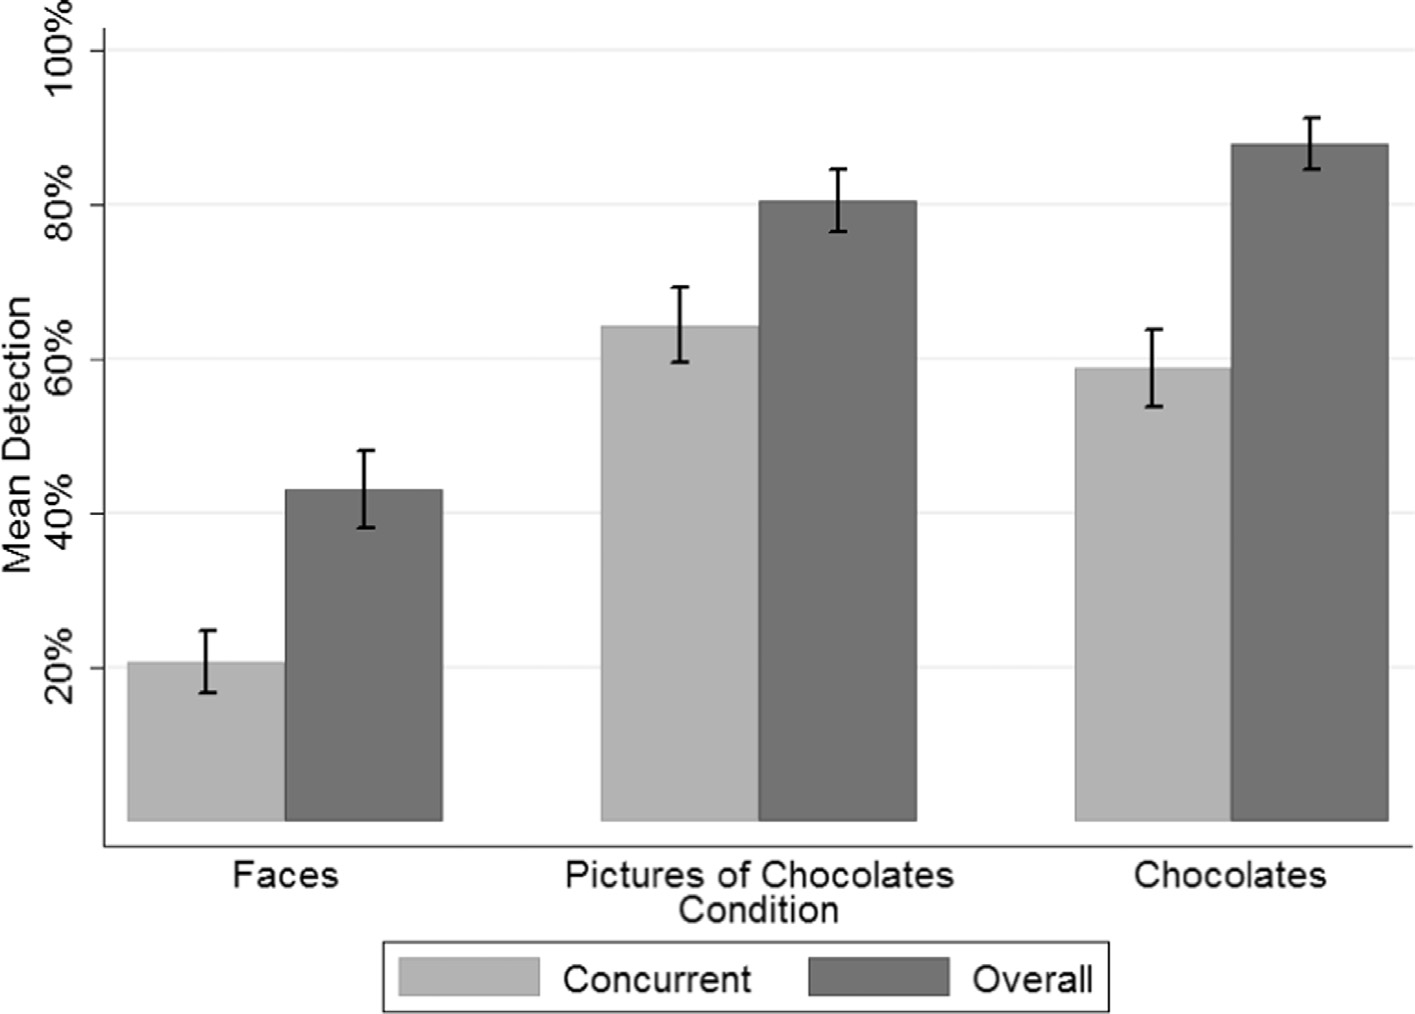
Figure 1. Mean detection rates across condition. “Overall” refers to circumstances in which participants reported noticing a mismatch either concurrently or retrospectively in the post-experimental debriefing.
To account for the within-subject variation and control for additional factors, a random effects logit regression was fitted to the data. The following model was estimated,
\[ \ln\left(\frac{\Pr[Detect=1\mid COND,Z,\eta_i]}{1+\Pr[Detect=1\mid COND,Z,\eta_i]}\right)_{it} =\theta_0+\beta COND_{it}+\delta Z_{it}+\eta_i+\varepsilon_{it}. \]
where \(\Pr[Detect=1\mid COND,Z,\eta_i]\) denotes the conditional probability of detection. \(COND_{it}\) is a vector denoting the three experimental conditions. \(Z_{it}\) is a vector of control variables including age, gender, game number, presentation order, ‘love of chocolate’, school fixed effects, and a measure of choice consistency. Finally, \(\eta_i\) is an individual random intercept parameter assumed to be drawn at random from a normally distributed population. The result of this estimation is presented in Table 1 for the three detection classifications: concurrent, retrospective, and either.
Table 1. Detection rates.
| Variable | Concurrent: coefficient | Concurrent: SE | Retrospective: coefficient | Retrospective: SE | Either: coefficient | Either: SE |
|---|---|---|---|---|---|---|
| Condition (Base = faces) | ||||||
| Pictures | 4.447*** | 1.235 | 0.179 | 0.597 | 3.699*** | 1.073 |
| Chocolates | 3.834*** | 1.203 | 0.460 | 0.572 | 3.300*** | 1.077 |
| Age (Base = 8) | ||||||
| 9 | −1.151 | 0.917 | 0.622 | 0.476 | −0.270 | 0.787 |
| 10 | −1.398 | 0.901 | 0.920** | 0.468 | 0.001 | 0.774 |
| 11 | −1.511* | 0.902 | 1.026** | 0.467 | 0.169 | 0.775 |
| 12 | −2.299** | 1.016 | 1.003** | 0.503 | −0.661 | 0.863 |
| Female | −0.251 | 0.290 | −0.100 | 0.125 | −0.431* | 0.255 |
| Game (Base = 1) | ||||||
| 2 | 0.074 | 0.213 | −0.093 | 0.114 | −0.158 | 0.222 |
| 3 | 0.112 | 0.214 | −0.110 | 0.114 | −0.179 | 0.221 |
| Trial order (Base = 1) | ||||||
| 2 | −0.236 | 0.451 | 0.113 | 0.197 | −0.062 | 0.387 |
| 3 | 1.020** | 0.462 | −0.340 | 0.209 | 0.438 | 0.402 |
| 4 | 0.782* | 0.459 | −0.083 | 0.205 | 0.648 | 0.409 |
| 5 | −0.517 | 0.457 | 0.304 | 0.195 | 0.177 | 0.397 |
| 6 | −0.626 | 0.459 | 0.197 | 0.197 | −0.226 | 0.391 |
| Love chocolate (Base = 3 or less) | ||||||
| 4 | 0.727 | 0.446 | 0.006 | 0.195 | 0.632* | 0.368 |
| 5 | 0.896** | 0.420 | 0.094 | 0.185 | 0.935*** | 0.349 |
| School fixed effects (Base = 1) | ||||||
| 2 | −0.109 | 0.463 | 1.195*** | 0.419 | 0.812** | 0.400 |
| 3 | −0.664 | 0.441 | 1.540*** | 0.409 | 0.663* | 0.374 |
| 4 | −1.084** | 0.531 | 1.248*** | 0.467 | −0.180 | 0.436 |
| Consistency | 0.015 | 0.012 | 0.004 | 0.005 | 0.014* | 0.009 |
| Consistency*condition (Base = faces) | ||||||
| Pictures | −0.014 | 0.014 | −0.005 | 0.007 | −0.015 | 0.012 |
| Chocolates | −0.011 | 0.013 | −0.003 | 0.006 | −0.002 | 0.012 |
| Constant | −2.389 | 1.505 | −2.810*** | 0.714 | −2.642** | 1.185 |
| \(\rho\) | 0.520*** | 0.054 | 0.597*** | 0.096 | 0.365*** | 0.067 |
| Observations | 1114 | 1114 | 1114 | |||
| Number of groups | 372 | 372 | 372 |
*** Significant at the one percent level. ** Significant at the five percent level. * Significant at the ten percent level.
First, to confirm the statistical significance of the descriptive results, we can observe the coefficients for the main treatment dummies (H2). The effect of the main treatment conditions, pictures of chocolates and actual chocolates, is large and has a statistically significant effect on detection rates for both concurrent and overall detection categories.
The data are also sufficiently rich to explore how the overall strength of preference relates to detection rates (H3). An individual’s overall liking for chocolate can be gauged by our ‘love of chocolate’ variable. Interestingly, while a 5-point scale was used, only three participants reported a score below three, confirming empirically that children exhibit a strong overall affinity for chocolates. Relative to those who rated their love of chocolate as three, there is a monotonically increasing probability of detecting mismatches, both concurrently and overall.
To assess whether the strength of the relative preference ordering within a set influenced detection rates (H4), Spearman’s rank correlation for pre- and post-evaluations of chocolates is taken as a measure of choice consistency. This measure is intended only as a proxy for preference between chocolates. To test whether this measures the strength of between chocolate preferences, we can inspect the coefficients on the interaction terms between condition and this consistency measure. As the measure of consistency relates solely to preferences for chocolates, there should be a positive and significant interaction term for the two chocolate condition and no significant effect for the faces condition.
For the overall detection rate, the coefficient on consistency is positive and significantly different from zero. While only significant at the 10% level, the level of noise in this measure and the general pattern of the effect across detection classifications are suggestive. Yet, if this measure of consistency is an indication of preference between chocolates, then the significant effect should be driven entirely by the two chocolate conditions. However, the interaction terms between the consistency score and the chocolate conditions are negative and not statistically different from zero. Given the positive coefficient on the consistency measure also holds for the faces condition, it suggests that this consistency score is not a reliable approach for gauging the strength of preferences between chocolates. 3
An alternative approach to assessing whether the strength of between chocolate preferences impacts detection rates is to include a dummy variable indicating when the participant’s favourite chocolate was an available option. Adding this to the baseline logistic regression indicates that detection rates were unchanged when an individual’s highest ranked chocolate was presented (p > 0.1). The strength of relative preference within the set of chocolates does not appear to mediate the incidence of CB.
To assess whether higher detection rates are due the effect of incentivisation (H5), we can compare the pictures of chocolates condition to the actual chocolates condition. Actually receiving the chocolate had no significant effect on detection rates compared to the pictures of chocolates across the three detection classifications (p > 0.1).
Given the substantial cognitive development that occurs between the ages of 8 and 12, potential age and gender effects must be controlled for explicitly. Fortunately, the relatively large sample size obtained permits investigation through the addition of age and gender dummies. For gender, there appears to be a general tendency for female participants to report fewer mismatches or “mistakes”. Whether this is a genuine effect, or due to a difference in reporting is unclear. Moreover, given that it is only significant at the 10% level and only reported for overall detection, caution is required when interpreting this result. For age, two distinct patterns emerge. For concurrent detection, the older the child, the less likely he or she is to report a mismatch concurrently. While not always statistically significant, the magnitude and direction of the effect exhibits a consistent monotonic pattern. This is offset by an almost equal but opposite effect for retrospective detection: as age increases, the probability of retrospective detection increases. When aggregated to overall detection there is no impact of age on detection rates, implying that older children were noticing the same number of mismatches, but were reluctant to report them concurrently.
Several other control variables were included in the analysis as robustness checks. First, given the within-subjects nature of the design, it is important to ensure that detection rates were not inflated due to early detections causing suspicion and scepticism regarding the integrity of the experimenter. Relative to the first condition, the probability of detection in the second and third conditions is not statistically different from zero. When considering trial order effects, participants were significantly more likely to detect concurrently when pictures of chocolates were presented first. However, this is not robust when detection is defined as concurrent or retrospective. One particular school fixed effect stands out; retrospective detection rates were higher for all schools when compared to the first school. Whether this was due to experimenter effects or school-specific characteristics is unclear. However, it should be noted that the schools that took part in this study were in areas that varied considerably in their socio-economic environments. Any reported school fixed-effects may be capturing this fact.
Several methods were employed to prevent participants from revealing the true nature of the experiment to their peers prior to participation. First, different classes took part in the experiment on either side of the recess periods so as to minimise possible confounds within classes. Second, children were asked explicitly at the end of each session not to tell any of their classmates about the details of the study. Despite these controls it is possible that the high detection rates reported are confounded by participants revealing the sleight-of-hand ploy to their peers. If that was the case, we should observe some false positives (i.e. reporting mismatches when there was no manipulation). Only one such case was reported and was due to the participant overhearing the debriefing session of a peer. However, to test for this statistically, we can split the sample between those who completed the experiment prior to the first recess period (when there was almost no opportunity to discuss the experiment with their peers) and those who completed the experiment after the recess period.
Fig. 2 presents the mean overall detection rates across these groups. While there are some observed differences in detection rates, the overall size of this difference is small relative to the magnitude of the condition effect. Including a ‘before recess’ dummy in the baseline models does not have a significant effect on any of the three detection classifications (p > 0.1). However when the base category is changed to the pictures condition, a significant negative effect emerges for the overall detection rate (p < 0.05). Taken together this suggests that any potential confounds due to participants revealing the true nature of the experiment to their peers are minimal.
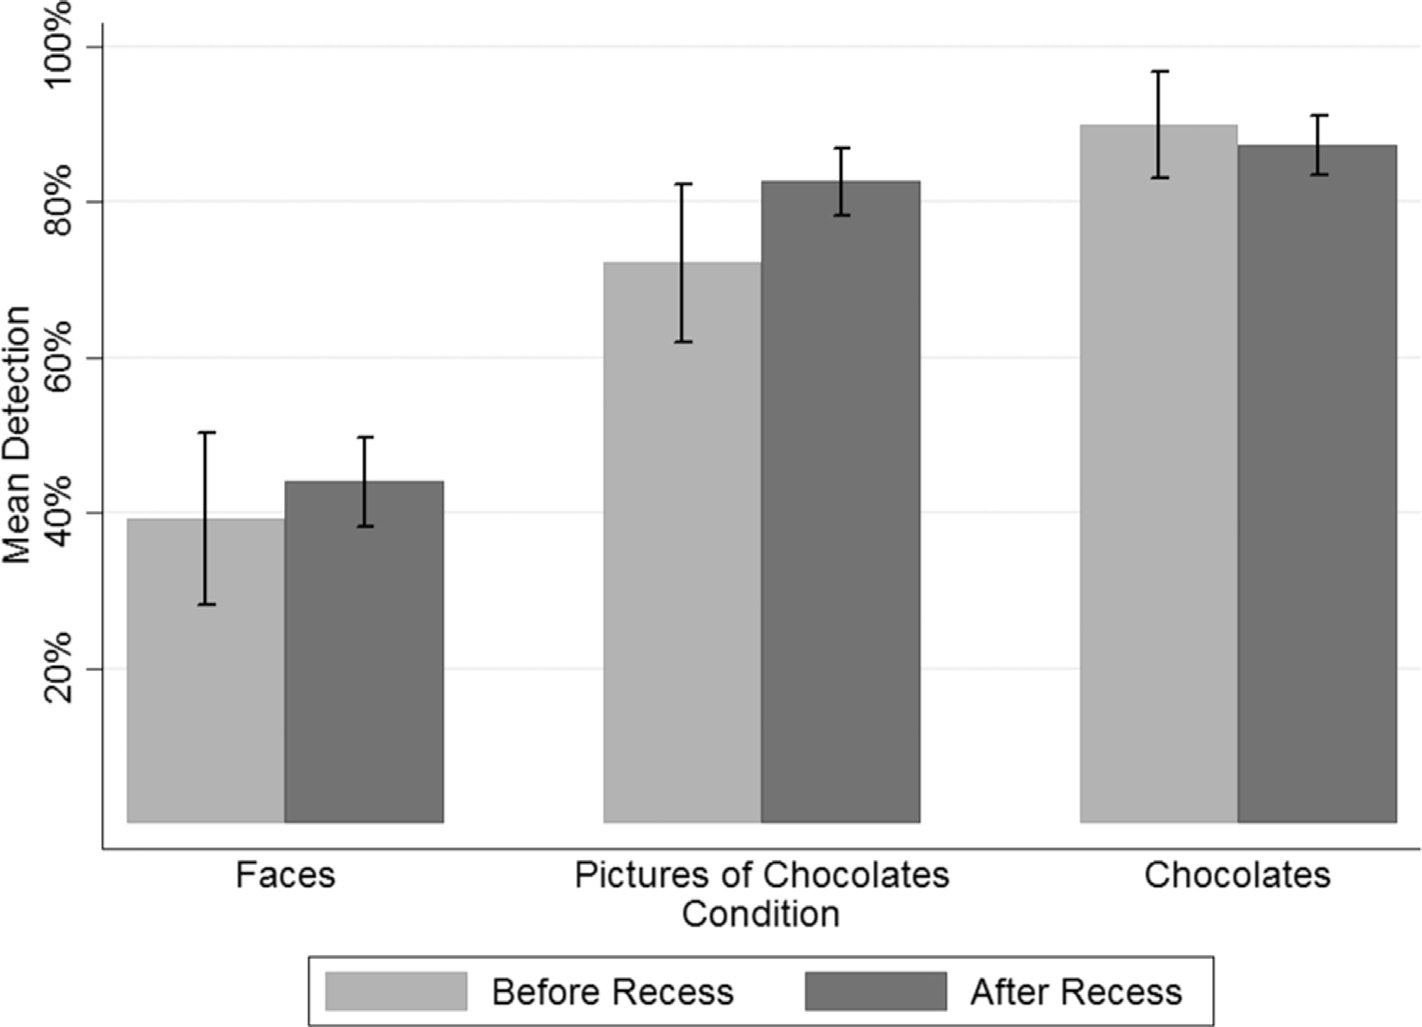
Figure 2. Overall detection rates before and after the recess period. “Overall” refers to circumstances in which participants reported noticing a mismatch either concurrently or retrospectively in the post-experimental debriefing. Before recess refers to the group of participants who, on a given day, completed the experiment prior to the first recess period.
Finally, to control for basic differences in perceptual similarity between the female faces and chocolates, an additional sample of 21 primary school children of similar age were asked to rank the similarity of pairs of chocolates and pairs of faces on a 7-point Likert scale. 4 The average similarity rating was 3.13 for female faces and 3.32 for chocolates. The overall difference was not statistically significant (p > 0.05), indicating that the results obtained were not driven by perceived differences in perceptual discriminability.
5. Discussion
An overall detection rate of 87.8% for chocolates and 80.4% for pictures of chocolates indicates that, in certain domains, manipulations of choices rarely go undetected. The use of stimuli which participants have a strong liking for appears to have induced a more cognisant cognition and CB rates approaching single digits, which is no larger than what would be expected given the well-documented stochastic element in consumer choice. Remarkably, the surge in detection rates occurred regardless of whether or not the participant actually received the chocolate, indicating that the incentive played a minimal role in mediating the CB effect.
While there is no clearly identifiable explanation for this effect, several potential explanations can be ruled out. First, this finding is not due to the use of children as participants, as the baseline detection rate for faces is in line with the percentages reported in the literature on CB to date (in particular, Johansson et al., 2005). Similarly, the result is not driven by the younger cohort within the sample, as there were no significant differences in overall detection rates between children of different ages.
Another possibility is that CB is due to memory effects; remembering which chocolate was chosen was markedly easier than recalling a nameless, monochrome female face. However, previous findings in the literature suggest that memory plays a minimal role in determining the incidence of CB. McLaughlin and Somerville (2013) found only a small, but significant, effect role for memory in portfolio decisions. Sagana, Sauerland and Merckelbach (2014), who tested memory impairment explicitly as a potential mechanism underlying the CB effect, found no impact on detection rates. Given the time elapsed between decision and outcome was less than a second, and the sheer magnitude of the effects we observe, memory effects cannot account for the results obtained.
In designing the current study, the goal was to use real consumer products that children would have encountered previously and for which they had a strong affinity. As a result, the chocolates had associated names and were presented in colour, and not greyscale. These additional sources of information may have driven higher detection rates compared to the female faces condition. Given that consumer products are generally observed in colour and have associated brand names, the high detection rates reported here may be more representative of consumer choice situations. However, many CB studies have used images and actual stimuli that appear in colour, both with and without names, and reported no increase in detection rates. For example, Hall et al. (2010) used jams and teas that were identified by name and presented in colour, yet detection rates were only 35%.
At first glance, our results may seem counterintuitive given that humans are particular adept at facial recognition and discrimination. However, perceptual discrimination is only the first step in any decision process. Making a choice, and subsequently updating one’s preferences is the outcome of a dynamic interaction between perception, initial preferences, beliefs, memory, cognitive integration and feedback. That we have documented CB for female faces, but not for a consumer good, suggests that the cause of this phenomenon is not due to a perceptual deficit. Indeed, the results from our discrimination task suggest perceptual ability was not a major factor in mediating detection rates.
It is important to note that the results obtained here pertain to the strength of preference for chocolate overall and not the strength of preference between chocolates. Neither the consistency of preference rankings nor the availability of an individual’s favourite chocolate as an option influenced detection rates. That individuals were no more likely to detect a mismatch when their favourite chocolate was up for grabs is surprising given the enhanced self-relevance of those particular choices. However, it does corroborate previous findings that the self-relevance of the choice does not impact detection rates in CB experiments (Sauerland et al., 2014). Conversely, it may be that such simple measures did not capture the relative strength of individuals’ preference order.
An alternative way to examine the role of preference strength is to look at the change in rank before and after receiving the chocolate. Previous studies have reported that for both participants who were ‘Choice Blind’ and those who detected manipulations, simply choosing an option increased its desirability (Johansson et al., 2014). If individuals still have to “discover” their preferences, then post-manipulation rankings for chocolates should mirror the effect in Johansson et al. (2014); believing you choose a chocolate should increase its attractiveness as much as actually choosing it. Interestingly, there is no change in the rating of the selected chocolate in either the pictures or actual chocolate conditions. For both the chosen and received chocolate, and for both detected and non-detected mismatches, the average rating change is less than one-tenth of a point (on a 5 point scale) and not statistically different from zero. At least for chocolates, preference appears to be invariant to choice.
The incidence of CB is reduced greatly for chocolates regardless of whether incentive compatible conditions are employed. The detection gap between actual chocolates and the pictures of chocolate conditions was only 7.4 percentage points and is not statistically significant. Conversely, the difference between faces and pictures of chocolates was 37.4 percentage points and highly significant. Any effect of incentivisation seems, at best, second-order and is not clearly identifiable in the current sample.
One potential explanation for the surge in detection rates is that children were more attentive to the decisions involving chocolates. However, Johansson et al. (2014), citing in preparation research, rule out inattention as a potential explanation; “the simple fact that the participants look at and fully attend to the manipulated images after presentation rules out inattention as a possible explanation for CB” (p. 286). Indeed, for both the female faces and chocolates conditions, the children in our study were clearly paying attention. However, anyone who has to reread several passages of a book will readily attest that attention is not an all-or-nothing outcome. Qualitatively, task engagement for the chocolate conditions was noticeably elevated. While we did not obtain any quantitative gauge of this measure in the current study, explicitly varying task engagement in the standard CB paradigm may prove fruitful in identifying the cognitive mechanisms underpinning CB. For example, are soccer fans unlikely to notice when, having selected Lionel Messi for their dream team, they find an imposter such as Wayne Rooney in his place?
The possible extensions of these findings are open to debate. Undoubtedly, they raise major concerns regarding the generalisability of CB to models of consumer choice. Evidently, the cognitive mechanisms involved in choosing between female faces and chocolates are quite different and the prevalence of CB varies considerably across them. Which provides a closer analogy to consumer choice is unclear.
From a theoretical perspective, these results appear to lend support to the discovered preferences approach to modelling consumer choice. Surveying the CB literature, it is noticeable how variable the incidence of CB is across stimuli (see Table 2). For stimuli that participants would typically have the least experience with, such as female faces or samples of jam and tea varieties, detection rates are the lowest. On the other hand for items that individuals confront regularly such as their social preferences, children’s toys and chocolates, detection rates were the highest. In light of the literature on discovered preferences, and the results presented here, CB may be best viewed as an error resulting from the early stages of preference development.
Table 2. Summary of CB detection rates across stimuli.
| Study | Stimuli | Concurrent detection | Retrospective detection | Overall detection |
|---|---|---|---|---|
| Johanssonet al. (2005) | Monochrome female faces | 26.0% | ||
| Johansson et al. (2006) | Monochrome female faces | 27.5% | ||
| Johansson, Hall & Sikstrom (2008) | Abstract Patterns | 19.0% | ||
| Johansson, Hall & Sikstrom (2008) | Monochrome female faces | 12.0% | ||
| Johansson, Hall & Sikstrom (2008) | Monochrome female faces (plus rating) | 39.0% | ||
| Hall et al. (2010) | Jam | 14.4% | 6.2% | 33.3% |
| Hall et al. (2010) | Tea | 13.8% | 6.9% | 32.2% |
| Hall, Johansson and Strandberg (2012) | Moral principles | 33.8% | 10.6% | 44.4% |
| Hall, Johansson and Strandberg (2012) | Moral issues | 48.6% | 1.4% | 50.0% |
| Sauerland, Sagana and Otgaar (2013) | Voice recordings | 19.0% | 10.0% | 29.0% |
| Hall et al. (2013) | Political survey | 22.0% | ||
| Johansson et al. (2014) | Monochrome female faces (and rating procedure) | 20.0% | 13.0% | 33.0% |
| Johansson et al. (2014) | Monochrome female faces (no rating procedure) | 10.0% | 16.0% | 26.0% |
| McLaughlin and Somerville (2013) | Similar Portfolios | – | – | 24.5% |
| McLaughlin and Somerville (2013) | Dissimilar Portfolios | 33.8% | ||
| McLaughlin and Somerville (2013) | Overall (depending on bound) | – | – | 28.5–37.2% |
| Sagana, Sauerland and Merckelbach (2013) | Female students and pictures of their faces | 31% | 28.2% | 59.2% |
| Steenfeldt-Kristensen and Thorton (2013) | Similar pairs of objects | 12.0% | 10.0% | 22.0% |
| Steenfeldt-Kristensen and Thorton (2013) | Dissimilar pairs of objects | 30.0% | 40.0% | 70.0% |
| Sagana, Sauerland and Merckelbach (2014) | Female photos | – | – | 41.0% |
| Sagana, Sauerland and Merckelbach (2014) | Exp 1: Mock crime video followed by facial recognition (evaluative choice) | 74.0% | 79.4%** | – |
| Sagana, Sauerland and Merckelbach (2014) | Exp 2: As above, but absolute choice with no delay to manipulated choice | 65.0–68.9% | 94.4–100%** | – |
| Sagana, Sauerland and Merckelbach (2014) | Exp 3: Like Exp 2, but 48hr delay before manipulated outcome | 31.7% | 60.6%** | – |
| Sauerland et al. (2014) | Classroom objects with high self-relevance (adolescents) | 11.1% | 57.8%** | – |
| Sauerland et al. (2014) | Classroom objects with low self-relevance (adolescents) | 9.5% | 54.8%** | – |
| Sauerland et al. (2014) | Toys high self-relevance (younger children) | 50.9% | 54.4%** | – |
| Sauerland et al. (2014) | Toys low self-relevance (younger children) | 50.9% | 52.7%** | – |
| Sauerland et al. (2014) | Toys high self-relevance (older children) | 62.9% | 72.6%** | – |
| Sauerland et al. (2014) | Toys low self-relevance (older children) | 51.6% | 56.5%** | – |
| Sauerland et al. (2014) | Erasers high self-relevance (younger children) | 56.3% | n/a | – |
| Sauerland et al. (2014) | Erasers low self-relevance (younger children) | 30.8% | n/a | – |
| Sauerland et al. (2014) | Erasers high self-relevance (older children) | 50.0% | n/a | – |
| Sauerland et al. (2014) | Erasers low self-relevance (older children) | 65.4% | n/a | – |
| Sagana, Sauerland and Merckelbach (2015) | Mock thief/victim lineups | 31.3% | 45%** | |
| Current study | Monochrome female faces | 20.6% | 22.4% | 43.0% |
| Current study | Pictures of familiar chocolates | 64.3% | 16.1% | 80.4% |
| Current study | Pictures of familiar chocolates (plus incentive) | 58.7% | 29.1% | 87.8% |
** Indicates where retrospective percentage is calculated from the sample that did not detect concurrently rather than the overall sample. Blank cells were unreported in the published table.
Acknowledgements
We would like to sincerely thank the staff and pupils at Terenure College Junior School, Scoil Áine, Lucan, St. Brigid’s, Castleknock and St. Molaga’s, Balbriggan for allowing us to conduct this study in their schools and for their generous assistance throughout. We would also like to thank Liam Delaney, Owen McLaughlin and Róisín White for their thoughtful and helpful contributions, particularly during the implementation phase. Our gratitude to Pete Lunn for detailed feedback on an earlier draft of this paper and to Adam Somerville for assistance with data collection.
Appendix A. Stimuli
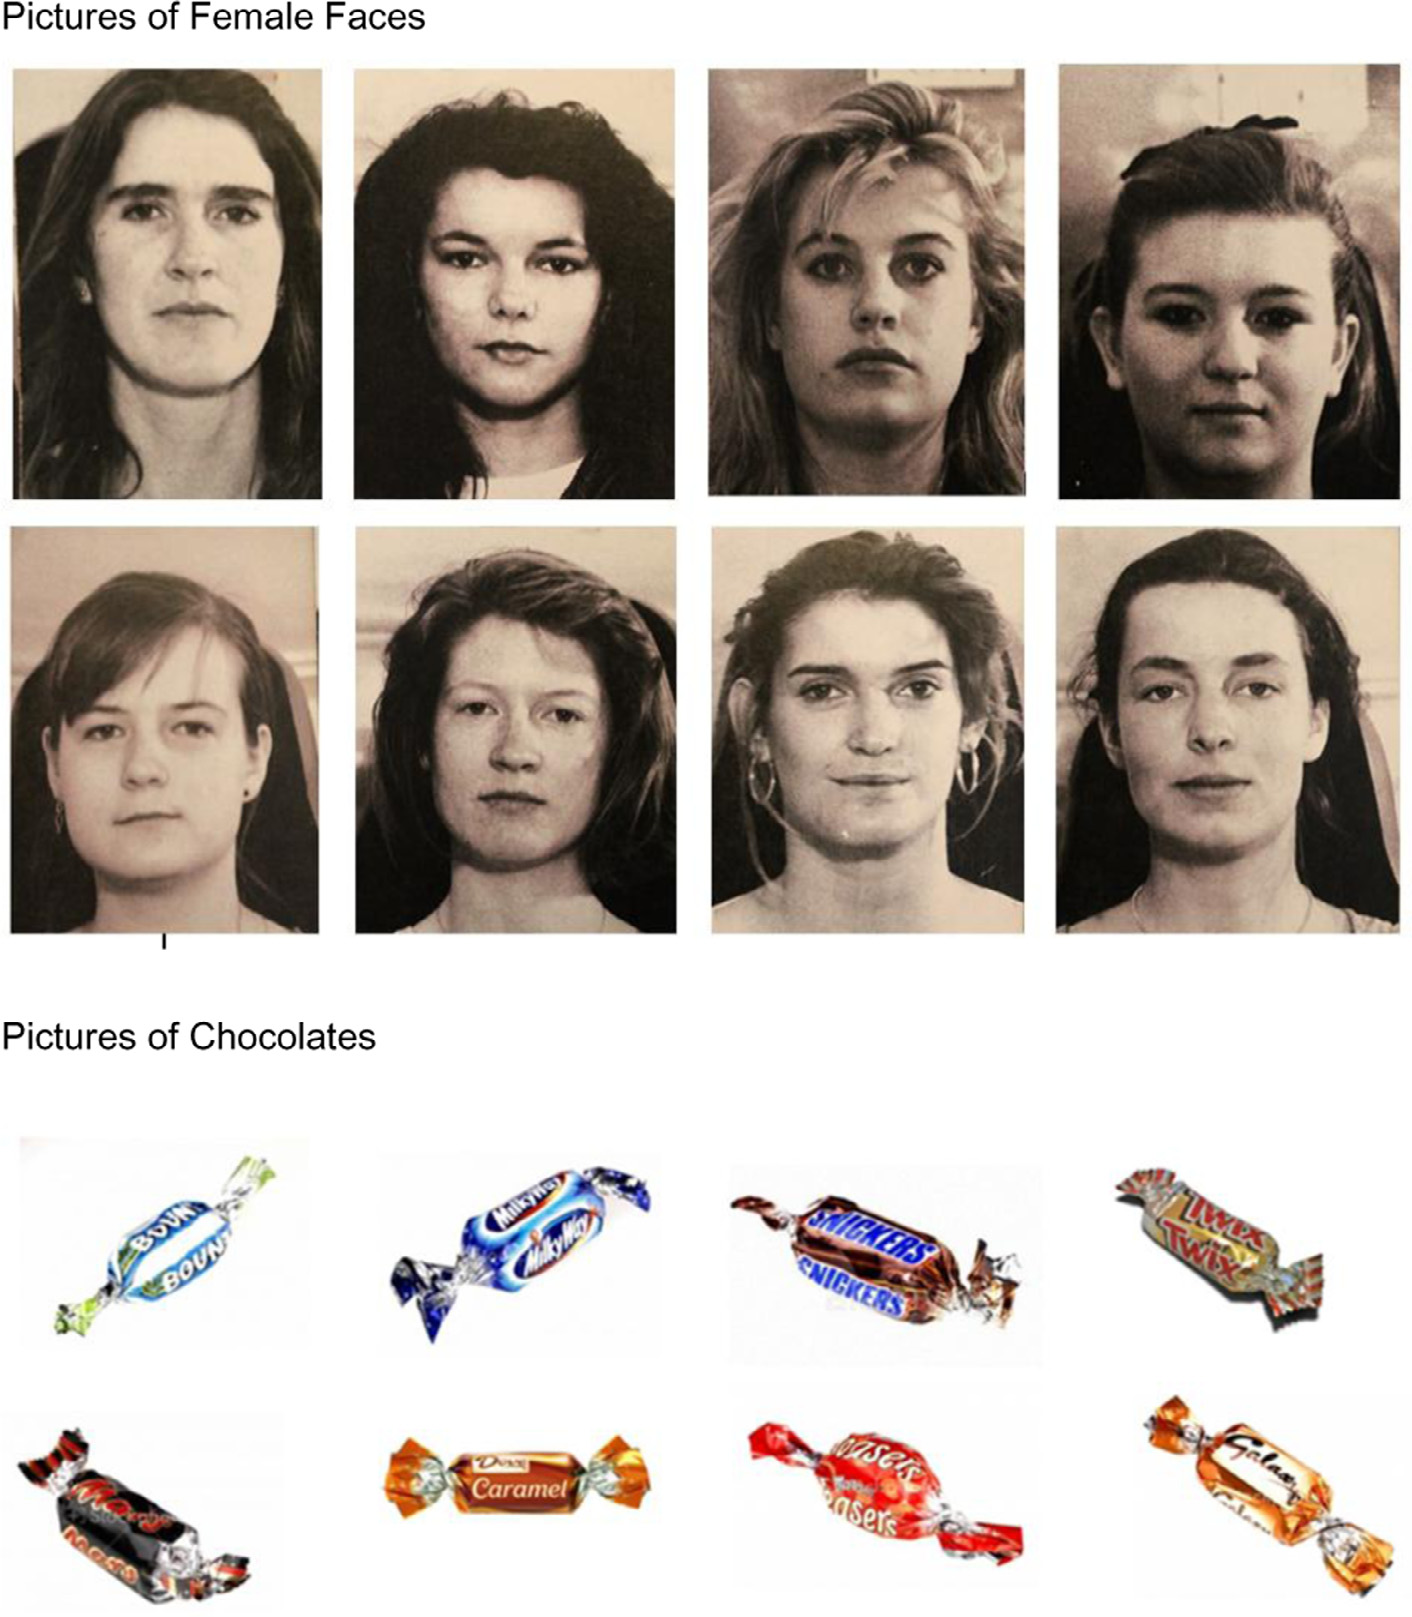
Appendix A stimuli: pictures of female faces and chocolates.
Appendix B. Slight-of-hand ploy

Figure A3.1. Snapshot sequence of manipulated trial in the faces condition.5
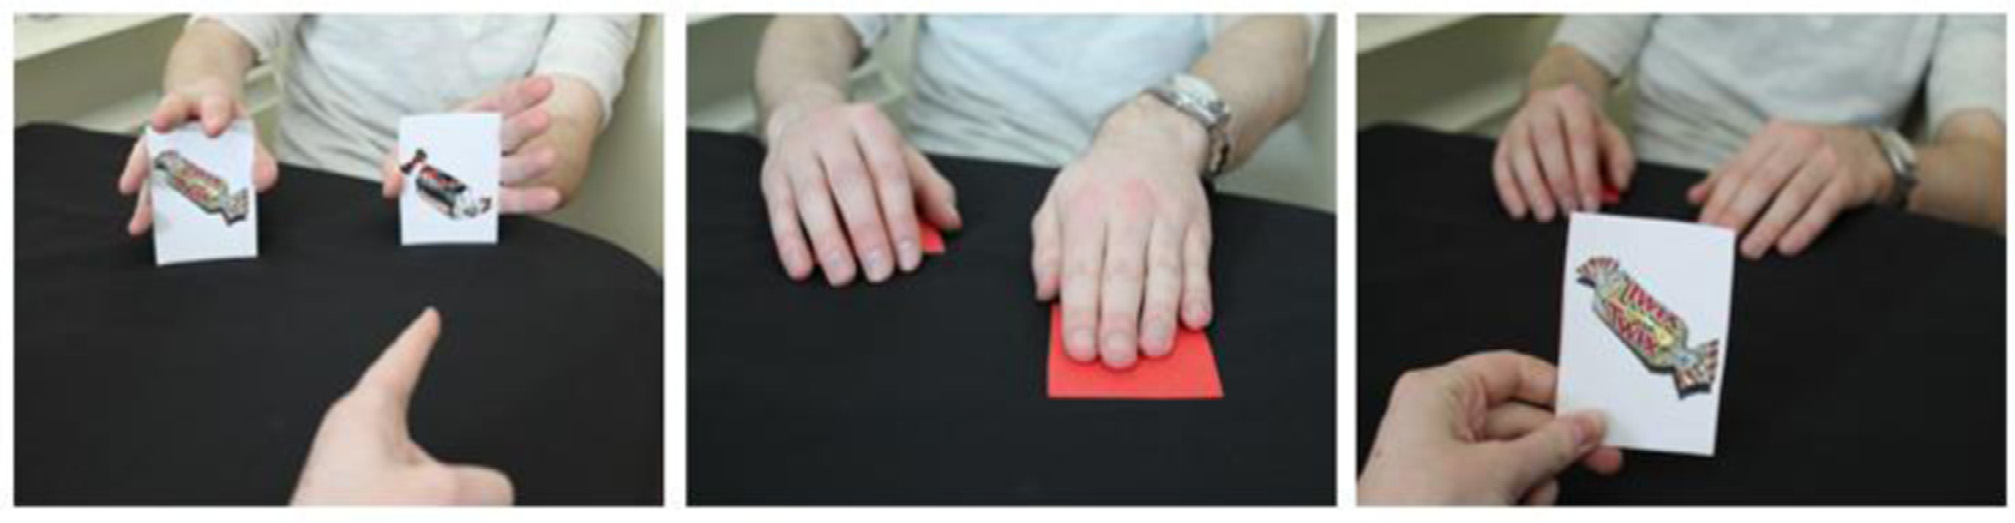
Figure A3.2. Snapshot sequence of manipulated trial in the pictures of chocolates (familiar) condition.
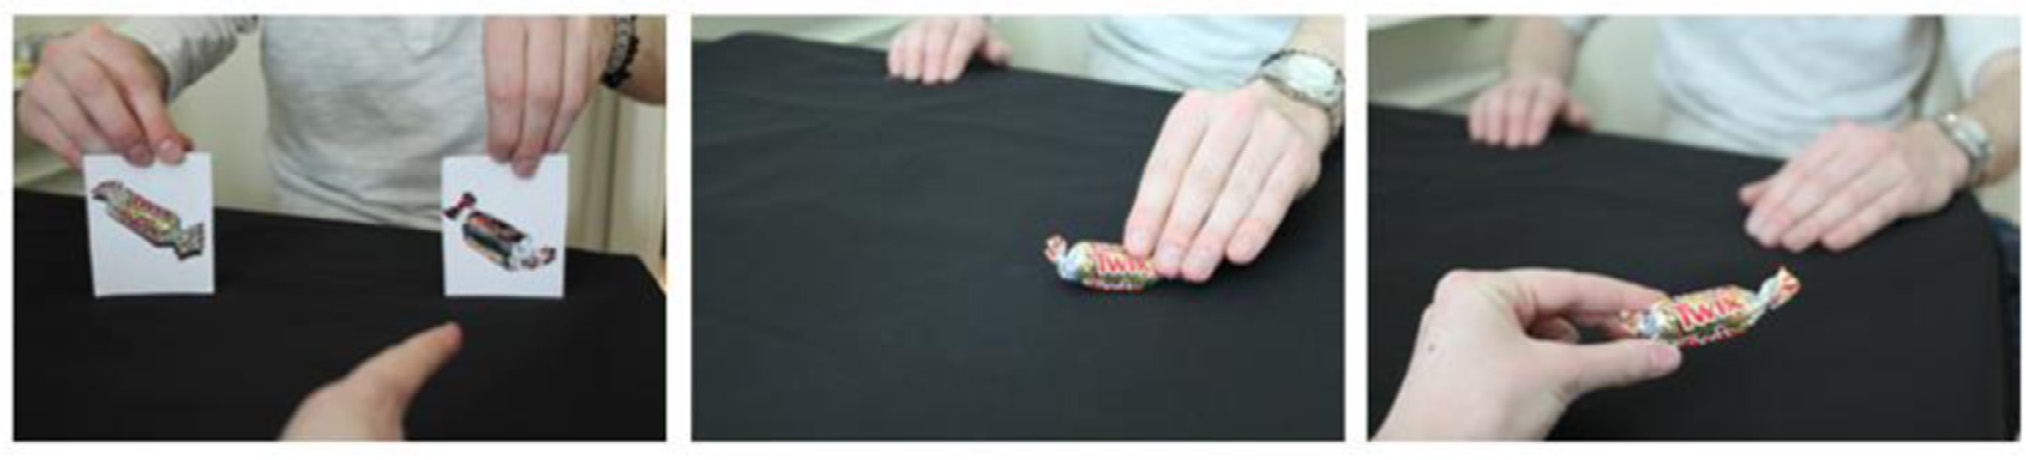
Figure A3.3. Snapshot sequence of manipulated trial in the chocolates (incentive) condition.
Appendix C. Post experiment questionnaire
- Are you happy with all of your choices today? ___________
- Did you find anything odd about the task? ___________
- Did you notice anything strange of the pictures or chocolates you were presented with? ____
- Do you think Jason might have made any mistakes, he is very tired today? ________
[if no to above]
- We’re planning another studying using magic – when people pick the chocolate/face they prefer we’re going to use a magic trick to present them with the picture that they didn’t pick. Do you think you would notice if we did this? _________
- [if no]. We did this on the second task in each game – we used a magic trick to swap your choice. Did you notice? ___________
Additional comments: ______________________________
References
Benartzi, Shlomo and Richard H. Thaler, 2001. “Naïve diversification strategies in defined contribution saving plans.” American Economic Review 91, 79–98.
Bettman, J.R., M.F. Luce, and J.W. Payne, 1998. “Constructive consumer choice processes.” Journal of Consumer Research 25(3), 187–217.
Cason, T.N. and C.R. Plott, 2014. “Misconceptions and game form recognition: challenges to theories of revealed preference and framing.” Journal of Political Economy 122(6), 1235–1270.
Chernev, A., 2003. “When more is less and less is more: the role of ideal point availability and assortment in consumer choice.” Journal of Consumer Research 30(2), 170–183.
Cox, J. and D. Grether, 1996. “’The preference reversal phenomenon: response mode, markets and incentives’.” Economic Theory 7(3), 381–405.
Gregory, Robin, Sarah Lichtenstein, and Paul Slovic, 1993. “Valuing environmental resources: a constructive approach.” Journal of Risk and Uncertainty 7, 177–197.
Grether, D. and C.R. Plott, 1979. “Economic theory of choice and the preference reversal phenomenon.” The American Economic Review 69(4), 623–638.
Hall, L., P. Johansson, B. Tärning, S. Sikström, and T. Deutgen, 2010. “Magic at the marketplace: choice blindness for the taste of jam and the smell of tea.” Cognition 117(1), 54–61.
Hall, L., P. Johansson, and T. Strandberg, 2012. “Lifting the veil of morality: choice blindness and attitude reversals on a self-transforming survey.” PloS One 7(9).
Hall, L., T. Strandberg, P. Pärnamets, A. Lind, B. Tärning, and P. Johansson, 2013. “How the polls can be both spot on and dead wrong: using choice blindness to shift political attitudes and voter intentions.” PloS One 8(4), e60554.
Jacobson, S., J. Delaney, and T. Moenig, 2014. “Discovered preferences for risky and non-risky goods.” manuscript.
Johansson, P., L. Hall, and N. Chater, 2012. “Preference change through choice.” In Dolan, R.J. and T. Sharot (Eds.), Neuroscience of Preference and Choice: Cognitive and Neural Mechanisms, 121–141. London: Academic Press.
Johansson, P., L. Hall, and S. Sikström, 2008. “From change blindness to choice blindness.” Psychologia 51(2), 142–155.
Johansson, P., L. Hall, S. Sikström, and A. Olsson, 2005. “Failure to detect mismatches between intention and outcome in a simple decision task.” Science 310(5745), 116–119.
Johansson, P., L. Hall, B. Tärning, S. Sikström, and N. Chater, 2014. “Choice blindness and preference change: You will like this paper better if you (believe you) chose to read it!.” Journal of Behavioral Decision Making 27(3), 281–289.
Johansson, P., L. Hall, S. Sikström, B. Tärning, and A. Lind, 2006. “How something can be said about telling more than we can know: on choice blindness and introspection.” Consciousness and Cognition 15(4), 673–692.
Lichtenstein, S. and P. Slovic, 1971. “Reversals of preference between bids and choices in gambling decisions.” Journal of Experimental Psychology 89(1), 46–55.
Loomes, G. and R. Sugden, 1995. “Incorporating a stochastic element into decision theories.” European Economic Review 39(3), 641–648.
List & Shrogen, 1999. “Price information and bidding behaviour in repeated second-price auctions.” The American Journal of Agricultural Economics 81, 942–949.
McLaughlin, O. and J. Somerville, 2013. “Choice blindness in financial decision making.” Judgment and Decision Making 8(5), 561–572.
Read, D., 2005. “Monetary incentives: What are they good for?” Journal of Economic Methodology 12(2), 265–276.
Read, D. and G. Loewenstein, 1995. “Diversification bias: explaining the discrepancy in variety seeking between combined and separated choices.” Journal of Experimental Psychology: Applied 1, 34–49.
Plott, C.R., 1996. “Rational individual behavior in markets and social choice processes: the discovered preference hypothesis.” In Arrow, K.J., E. Colombatto, M. Perlman, and C. Schmidt (Eds.), Proceedings of the IEA Conference on Rational Foundations of Economic Behaviour. 225–250 Turin, Italy International Economic Association Conference.
Sagana, A., M. Sauerland, and H. Merckelbach, 2013. “Witnesses’ blindness for their own facial recognition decisions: a field study.” Behavioral Sciences and The Law 31(5), 624–636.
Sagana, A., M. Sauerland, and H. Merckelbach, 2014. “Memory impairment is not sufficient for choice blindness to occur.” Frontiers in Psychology 5, 449.
Sagana, A., M. Sauerland, and H. Merckelbach, 2015. “The effect of choice reversals on blindness for identification decisions.” Psychology, Crime & Law, 1–12.
Sauerland, M., A. Sagana, and H. Otgaar, 2013. “Theoretical and legal issues related to choice blindness for voices.” Legal and Criminological Psychology 18(2), 371–381.
Sauerland, M., A. Sagana, H. Otgaar, and N.J. Broers, 2014. “Self-relevance does not moderate choice blindness in adolescents and children.” PLoS One 9(6), e98563.
Steenfeldt-Kristensen, C. and I.M. Thornton, 2013. “Haptic choice blindness.” iPerception 4(3), 207.
Tversky, A., P. Slovic, and D. Kahneman, 1990. “The causes of preference reversal.” American Economic Review 80(1), 204–217.
Wallis, W.A. and M. Friedman, 1942. “The empirical derivation of indifference functions.” Studies in mathematical economics and econometrics in memory of Henry Schultz, 175–189.
Woodford, M., 2014. “Stochastic choice: an optimizing neuroeconomic model.” The American Economic Review 104(5), 495–500.